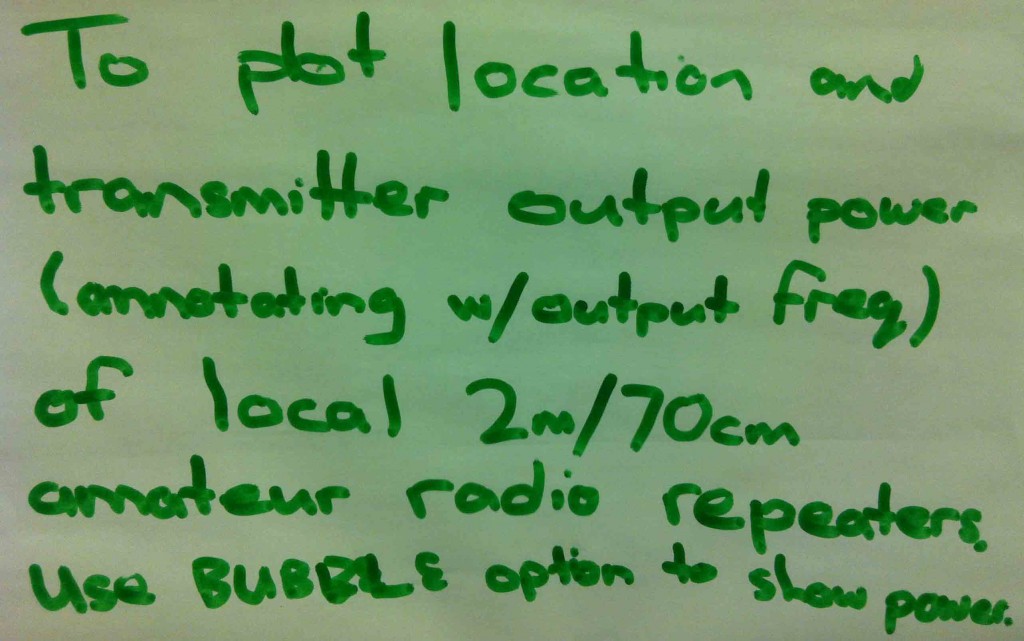
I have to say that I've never heard of the Bubble option, so I looked it up on support.sas.com (my go-to place for searches on customer problems or to simply to learn something about SAS). The search led me to documentation for the statement options in SAS ODS Graphics. So, I assume the author below is talking about an option to produce a Bubble plot.
The explanation that support.sas.com provided for me is, "Creates a bubble plot in which two variables determine the location of the bubble centers and a third variable controls the size of the bubble." So, I checked for two or three papers to start you on your journey:
- Using SAS/GRAPH® Annotate to Create Customized Control Charts
- Using Proc Gplot and Proc Reg Together to Make One Great Graph
- Introduction to ODS Graphics for the Non-Statistician

Take a look at the papers, and then let me know if I'm on the right track or missed it altogether. Thanks!!

2 Comments
If memory serves, I'd say you're right on target. I'm not sure bubble plots were available 25 years ago but I have seen them since and your interpretation seems quite accurate.
William ~ thank you for taking the time to set my mind at ease. I'm always trying to send valuable, accurate information to SAS users.