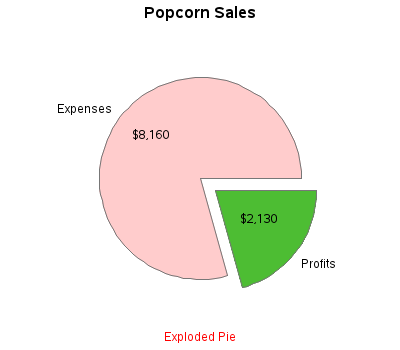
There's an old expression "easy as pie." Have you ever tried to bake a pie??? ... It's not so easy, LOL! And neither is using pie charts correctly! :) Below are several examples of different kinds of pie charts you can create with SAS/GRAPH. And at the bottom of this
Tag: how to learn sas
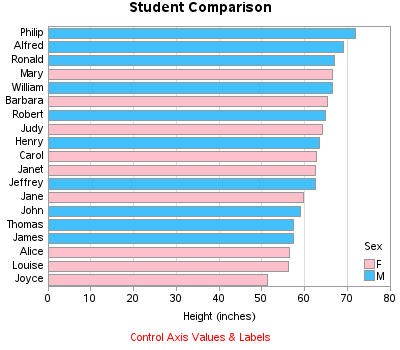
Do you know how to create a bar chart using SAS, and when to use what kind of bar chart?!? If the answer doesn't come to you "easy as pie" then this blog is for you! Below are several examples of different kinds of bar charts you can create with SAS/GRAPH.
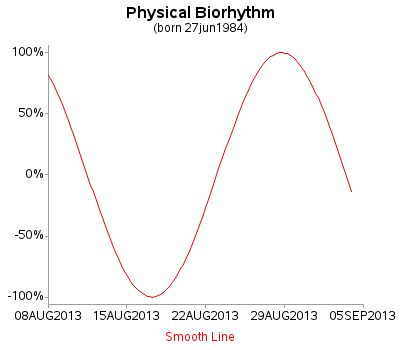
Do you know (right off the top of your head) the simple SAS/GRAPH code you would use to create line graphs? ... If not, then this tutorial is for you! A line plot is basically a scatter plot where the markers are connected. A line plot should only be used
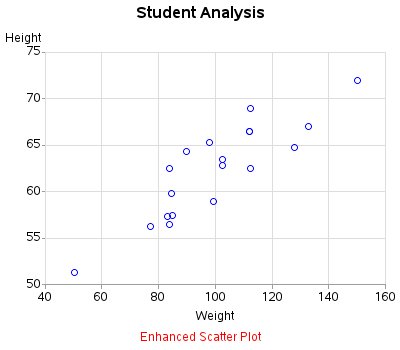
Scatter plots are probably the simplest kind of graph, and provide a great way to visually look for relationships between two variables. But, do you know (right off the top of your head) the simple SAS/GRAPH code you would use to create them? ... This tutorial leads you step-by-step through the
Have you used multivariate procedures in SAS and wanted to save out scores? Some procedures, such as FACTOR, CANDISC, CANCORR, PRINCOMP, and others have an OUT= option to save scores to the input data set. However, to score a new data set, or to perform scoring with multivariate procedures that
A few days after I posted part 1 of this blog post, an interesting message popped up on Twitter from @annmariastat: Confused. If you can get #SAS certification in 3 months what exactly are you being certified as? How much can anyone learn in 3 months? A fair question, and
I'm happy to report that I have achieved my SAS Certified Base Programmer credential. w00t!. I took my first SAS programming course on March 10th and passed my exam on June 18th (so I guess a more accurate title would say 3 months and 8 days!). I thought I would