Your biggest problem with maps used to be learning how to fold a paper road map. Today, with the advent of GPS, Google Maps, and location-specific data, the bar has been raised! ... you now need to know how to plot your data on a map! Below are several examples of different kinds
Tag: gmap
A beginner's tutorial on ... geographical maps
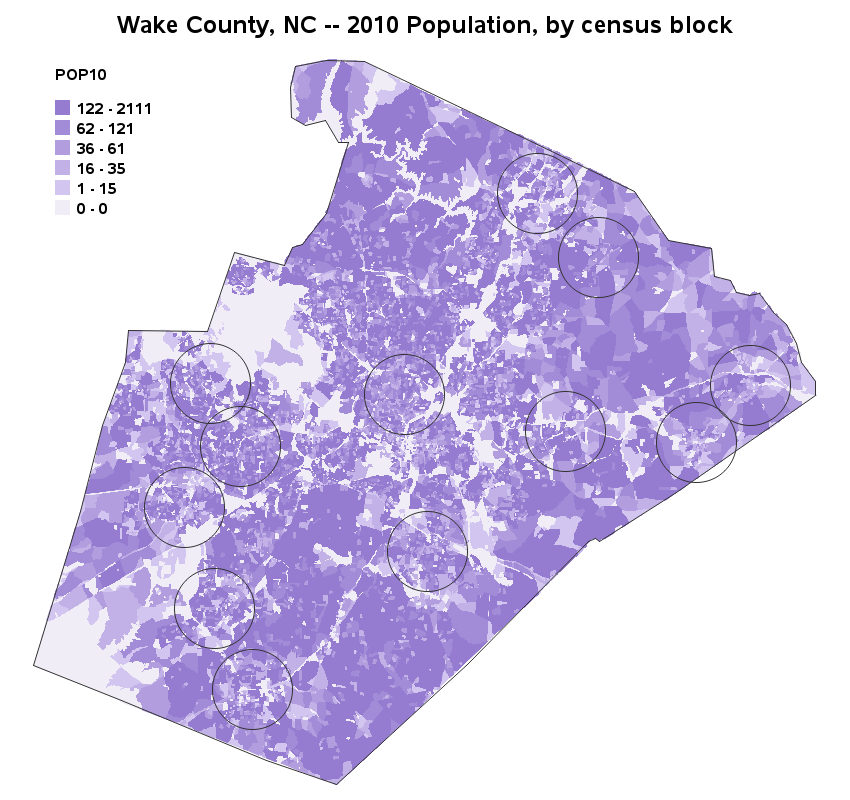
Census block maps in SAS
I've heard many customers ask "Can SAS do/use/handle census block maps?" My answer was "of course!" ... but I never really had any examples to show/prove that. Well, now I do! :) First, you need to locate & download the shape files for the census blocks you're interested in plotting. For
Adding pop-up graphs to your SAS/GRAPHs
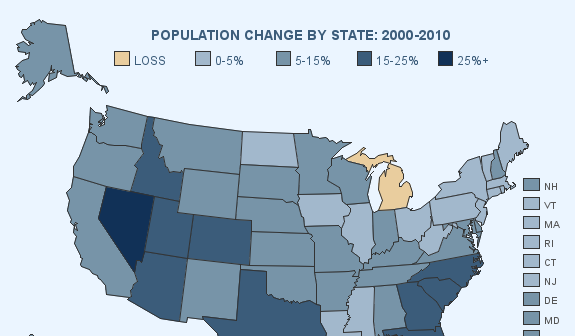
By now, most of you probably already know how to add drill downs and hover text to your SAS graphs. But did you know you can add pop-up images and graphs? Here are a couple of examples ... In this first example, when you hover your mouse over each state, you