SAS Learning Post
Technical tips and tricks from SAS instructors, authors and other SAS experts.
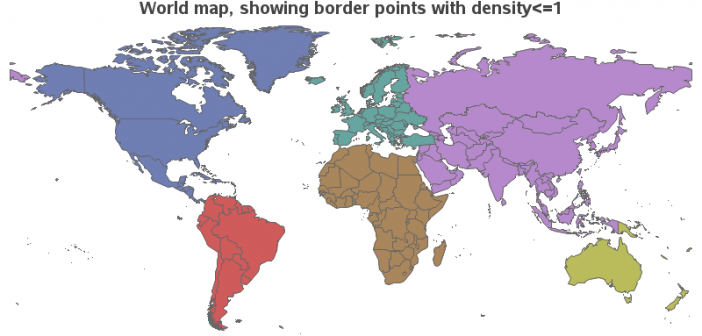
With the advent of things like car GPS & Google Maps, and a steady supply of nice maps from certain news sources (such as the New York Times), people have finally embraced the idea that mapping data can be very useful. And if you are into data visualization, you have

For those of you who don't have SAS/Graph's Proc GMap, I recently showed how to 'fake' a variety of maps using Proc SGplot polygons. So far I've written blogs on creating: pretty maps, gradient shaded choropleth maps, and maps with markers at zip codes. And now (by special request from

There's an old song that starts out, "You Can Get Anything You Want at Alice's Restaurant." Well, maybe you are too young to know that song, but if you’re a SAS users, you’ll be glad to know that you can capture anything produced by any SAS procedure (even if the

