SAS Learning Post
Technical tips and tricks from SAS instructors, authors and other SAS experts.
Anybody can come up with a list of simple colors, such as red, green, and blue. If you're a bit more color savvy, you might even throw in indigo, magenta, and fuchsia. But what about more obscure names such as cornsilk, mistyrose, and midnightblue? This blog post will help you

Everyone who knows about monarch butterflies, likes monarch butterflies. This blog post focuses on their food source - milkweed. And to get you in the mood, here's an amazingly beautiful picture my friend Eniko made of a monarch: In recent years, I had heard reports of the dwindling number of

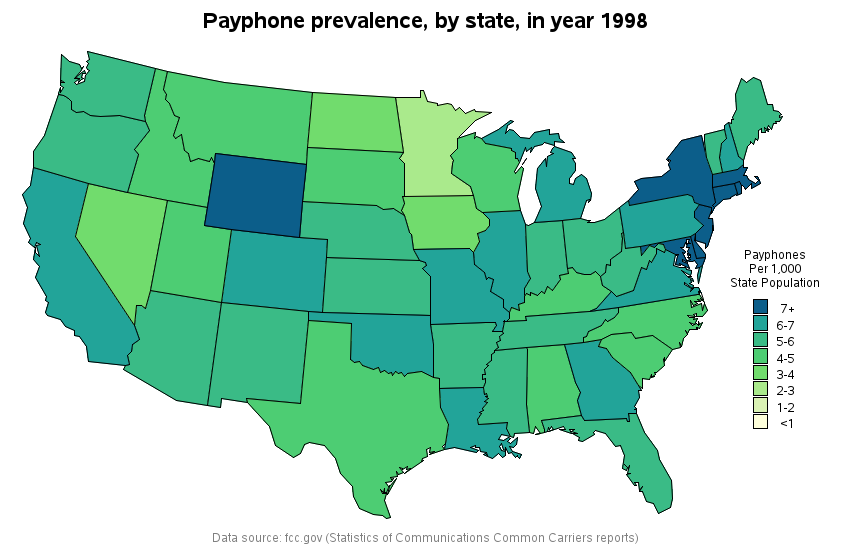
What do people have in common who have used analog clocks, vinyl records, and payphones? They were all probably born before 1980! Now, let's focus on those payphones!... A lot of young kids these days can't imagine a world where everyone doesn't have a wireless phone. My buddy Ed likes
