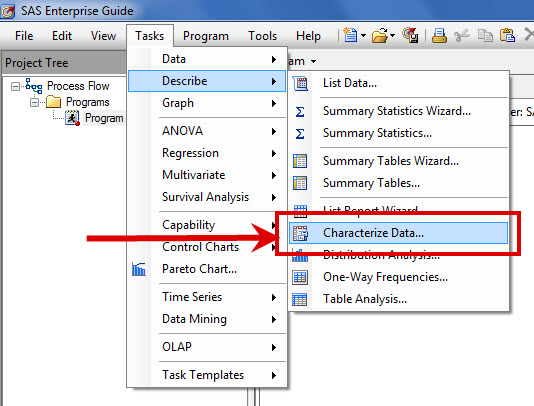
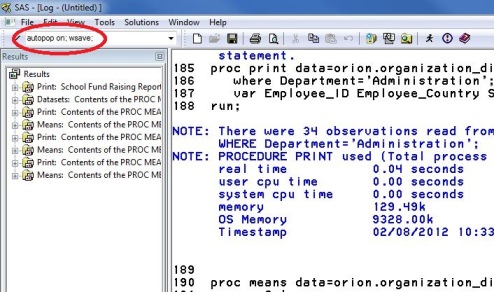
When working with "big data" you usually have too many points to view in a plot, and end up subsetting or summarizing the data. But now, in SAS 9.3, you have an alternative! For example, the following scatter plot of 10,000+ points is just a visual "blob": But using a new
English
Wizard Harry Potter makes magic just waving his wand around and shouting out spells. Using SAS Enterprise Guide (and you are welcome to shout out your own commands too) you can create some magic, allowing the Stored Process Wizard to code for you. On Step 2, the "Include code for"
A common question really and one that I get after posting code like yesterday's All SAS Stored Process Locations Report. The neat trick is just to type METABROWSE in a BASE SAS command window. (There are two other commands: METACON and METAFIND. Has anyone got any tips on when those
Stored process code can exist within the metadata itself for version 9.3 (the benefits of which I discussed earlier). But for all other versions (and as a option in version 9.3) the SAS code is stored as a .sas file within the server's file system (or mapped folder/drive structure). When editing
The date prompt from SAS Prompt Framework provides the options of single selection or a range, however what if you need to select multiple individual dates such as Monday (May 28), Wednesday (May 30), and Friday (June 1) of last week? There are a few alternatives to accomplishing this. Option
Did you change your LinkedIn password yesterday? (If you didn’t, you should!) But did it happen to be the same as your corporate password? First, tisk tisk. Second, change your corporate password NOW! Ok, now that this is done ~ don’t let your saved connection profile for SAS applications lock
What if you would like to make a copy of an existing stored process to test out your changes before making them live? The copy command is available from within SAS Management Console or from the SAS Enterprise Guide Open Stored Process GUI as seen below (note you can only
What tiny looking operator packs a mighty punch with large datasets? Your queries are big. Your reports span multiple columns. To top it all you have to summarize data in multiple ways. Are you tempted to throw in the towel? Do you feel like saying a firm “Can’t be done”
A SAS user (who lives in the the US) emailed me a question about SAS functions. He was reading UTC (Coordinated Universal Time) datetime values from server logs, and to make future calculations and comparisons easier, he wanted to transform the value to local datetime. The INTNX() function worked great, but
Bill Franks’s new book, Taming the Big Data Tidal Wave: Finding Opportunities in Huge Data Streams with Advanced Analytics, has just released. This book shows how big data is changing the world of analytics; what people, processes, technologies, and mindsets are necessary to succeed in analytics in this new era;