The East Coast of the US got quite a snowstorm this past weekend, but did your area get enough snow to brag about? Let's see what the data says...
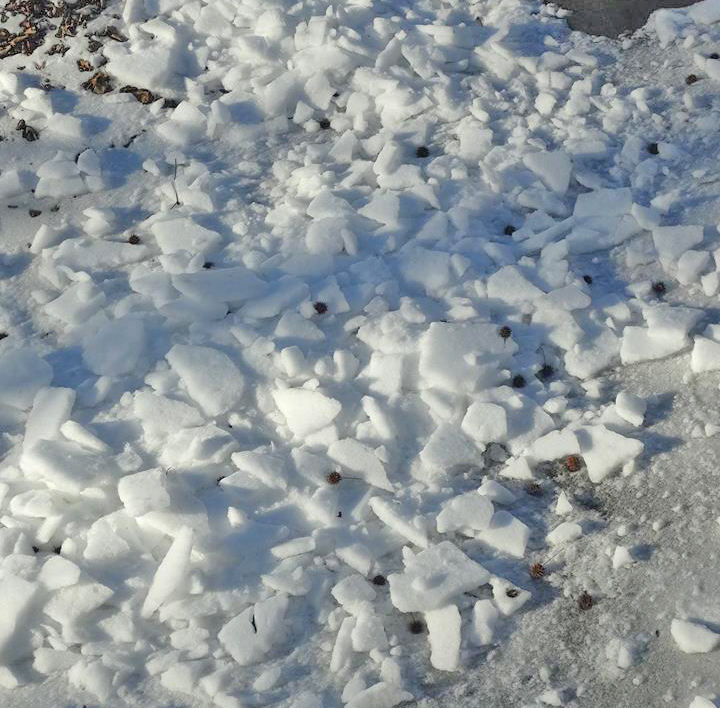
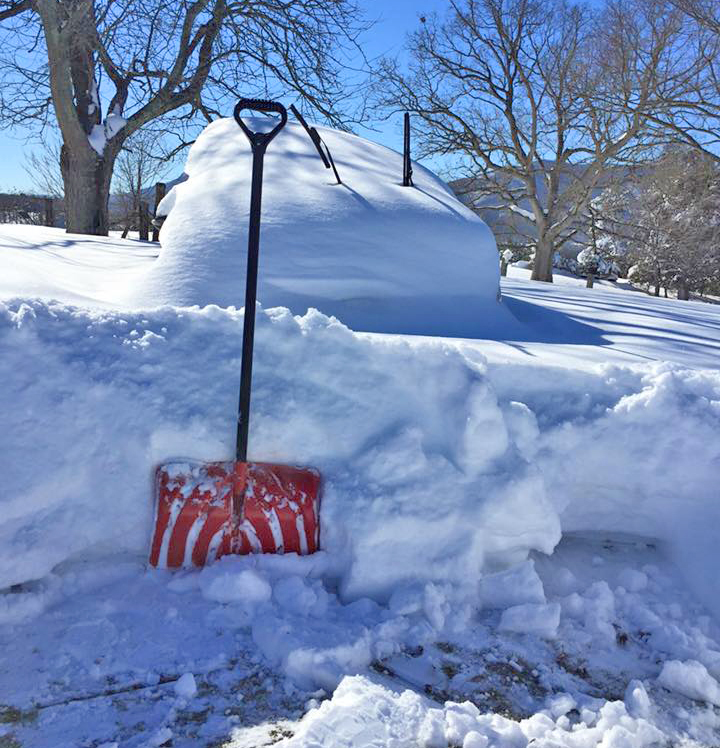
Before we get started, here are a couple pictures of the snow. The first one is from my driveway - we didn't get deep snow, but a couple inches of sleet and ice meant we had to chisel it off our driveways. The second picture is from my friend Janeane, who lives in up in the mountains of Virginia - she claims there's a car somewhere under that mountain of snow!
Now, let's have a look at the data!... I found some raw data on the NOAA website, downloaded the text file, and wrote some code to import it into SAS. In their data, they used a -9999 value to represent 'missing' data, so I converted those to actual SAS missing values. Now I have a nice clean dataset, complete with latitude & longitude coordinates, ready to analyze.
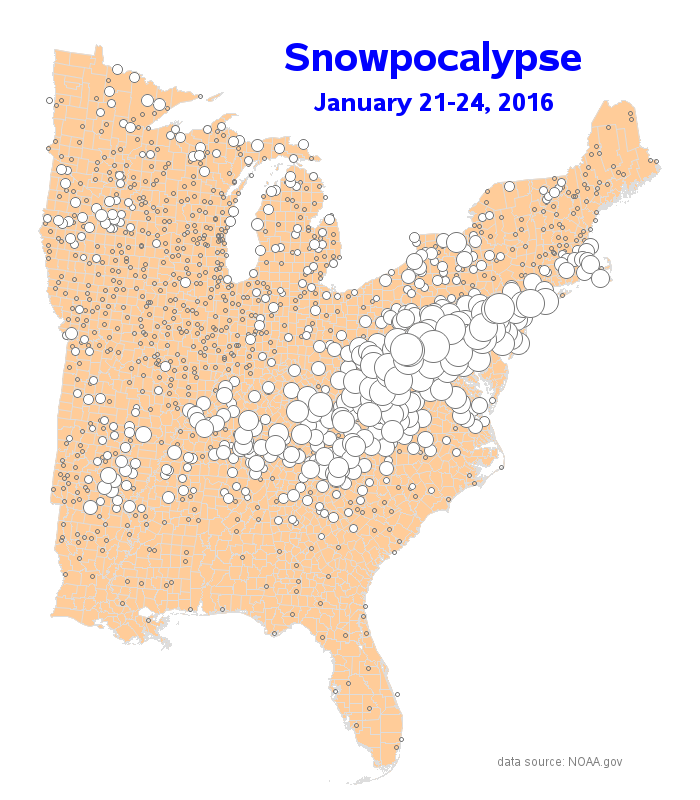
I summed the snowfall values for January 21-24, and then plotted the data on a map, using the summed totals to control the sizes of the bubbles. The map is pretty simple, but I think it does a good job of showing which areas were hardest-hit by this winter storm. (You can click the image below to see the interactive version, with html hover-text over each bubble.)
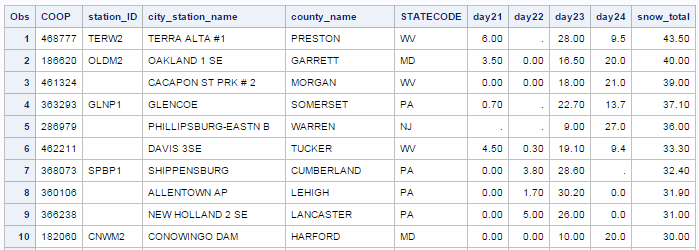
Below the map, I show a table of the 100 areas with the most snow. Here's a screen capture of the top 10 (click the screen capture to see the map and full list).
So, it looks like Preston County, West Virginia is the 'winner' with 43.5 inches of snow! (that's 110.49 centimeters, for you folks in the rest of the world!)How did you measure up in Snowpocalypse 2016? #snow #analytics Share on X
What's the deepest snow you've ever experienced?


4 Comments
I love your maps. They show the major points of the analysis
Thanks Martha!
We had a Halloween blizzard in Minneapolis in 1991 that brought 27"of snow. We have also had three separate snows that collapsed the roof of the Viking's stadium
Wow! - You've definitely got "bragging rights"! :)