I recently read a Washington Post article about the euro versus the dollar, and I wanted to analyze the data myself to see whether the article was simply stating the facts, or "sensationalizing" things.
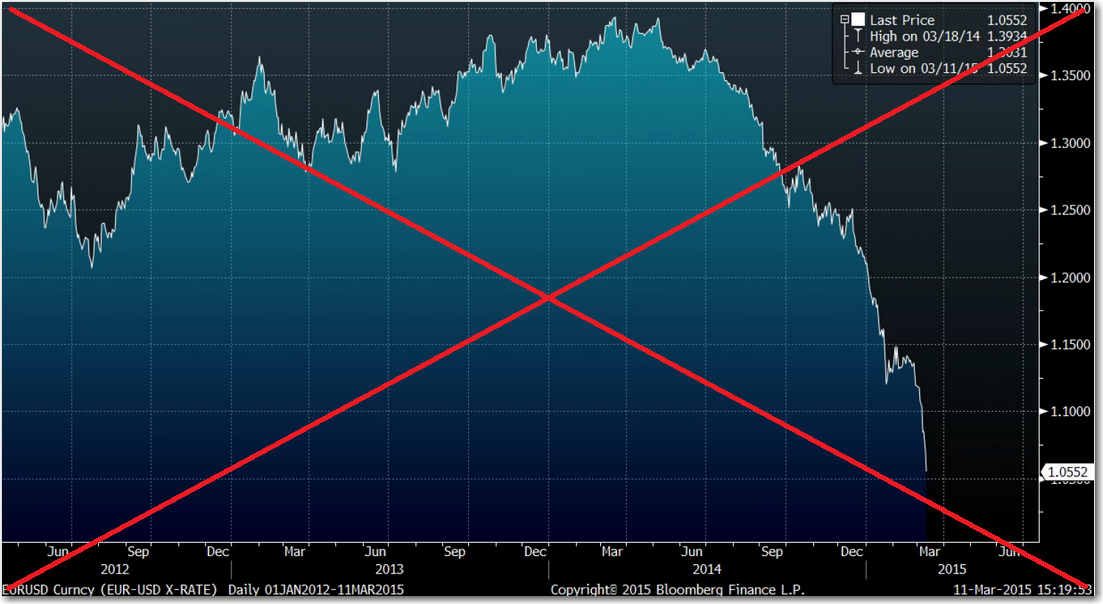
The washingtonpost.com article started with the headline, "This is historic: The dollar will soon be worth more than the euro." And the article had the following graph showing the value of the euro dropping:
Based solely on the title and the graph (which is probably all that most people look at), I assumed that the exchange rate had always been about 1.25, and had recently started dropping towards 1.00, and that this was an unprecedented historic event. But as I read the details in the article, I started to become a bit more skeptical, and decided to find the actual data, and plot it myself.
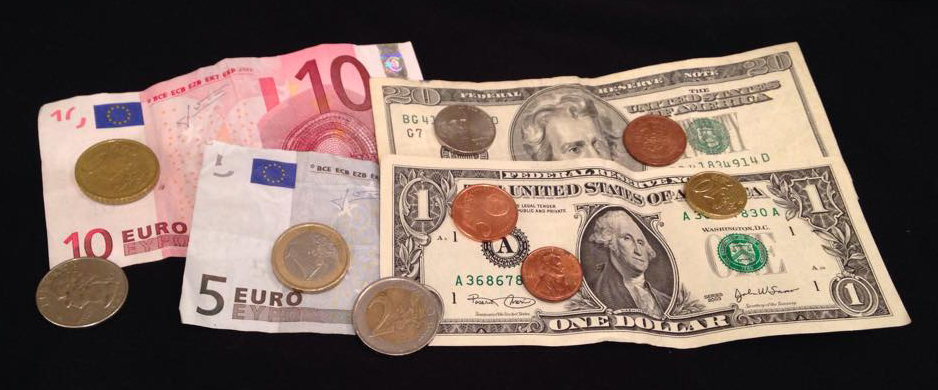
Before we get down to business, here's a picture of some euros and dollars my friend Margie just happened to have ...
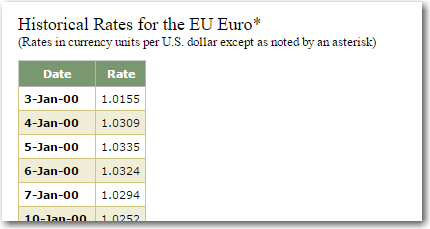
And now, let's get to the SAS analysis! ... I went to the federalreserve.gov website, and found the raw data...
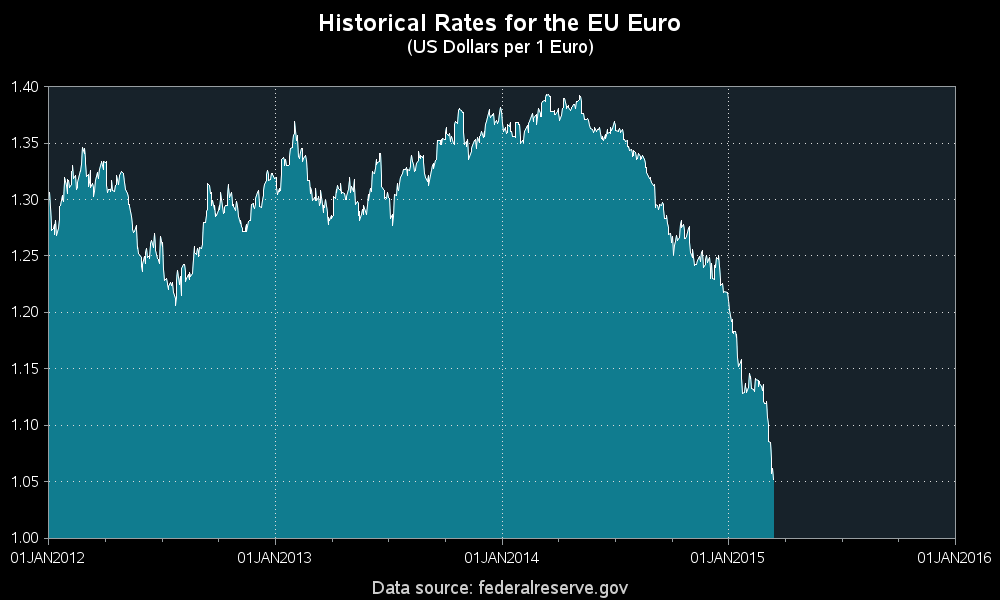
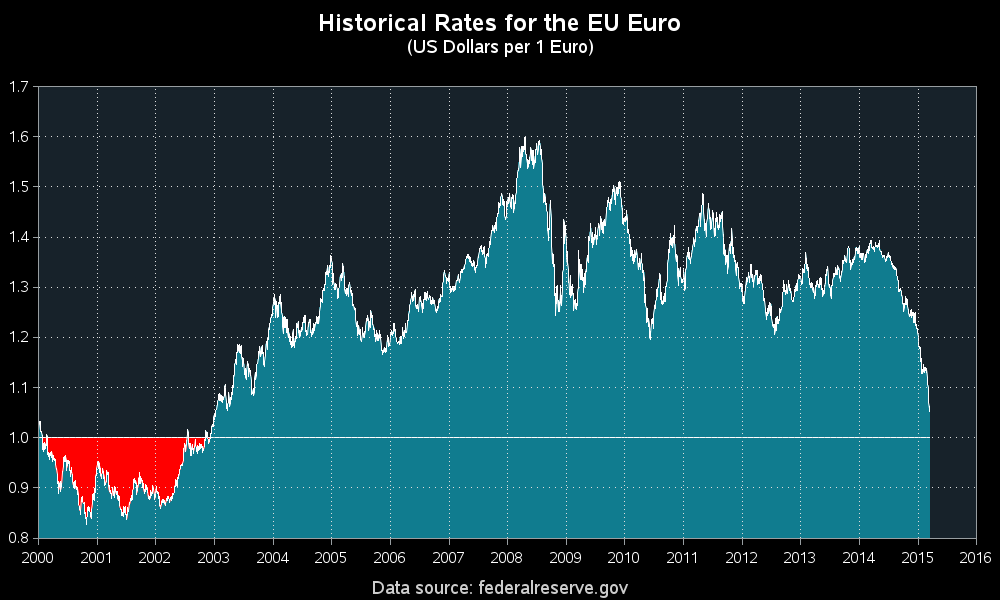
They displayed the data in an html table, so I wrote a SAS job to read the html code directly from their web page, and parse out the data values. I then used Proc Gplot to create a graph very similar to theirs (both the visual colors and style, and the years covered). And, sure enough, my graph showed the same thing (ie, the exchange rate hovered around 1.25 during that time period, and had a recent drop heading towards 1.00).
But, being a natural skeptic and a Curious George, I wondered if the data prior to 2012 told the same story? The Federal Reserve table contained data back to year 2000, so I tweaked my Gplot code a bit to plot all the data. And would you look at that - the euro was worth less than a dollar back in 2000-2003! So, while the sudden rate of the recent drop might be 'historic' a euro being worth less than a dollar is not a new or unique event.
Now a question for you economists - who is it good for, and bad for, when the value of the euro falls against the dollar?

12 Comments
Pingback: Is Greece in hot water, financially? | The SAS Training Post
You didn't need to go to all that trouble. The St. Louis branch of the Fed already has that data plotted out in a system they call FRED. https://research.stlouisfed.org/fred2/series/DEXUSEU
Nice!
But which graph do you think provides a better comparison?
(pick mine, pick mine! LOL)
Hi Robert,
Thank you the great graph. I downloaded the data from http://www.oanda.com/currency/historical-rates/ on 3/11/2015, and found the similar results as yours:
€1 EURO to USD
Min 10/26/2000 $0.8279
Max 4/24/2008 $1.5951
on 3/11/2015 $1.0774
Average $1.2243
Standard Deviation $0.1811
(n-5,250)
Great graph - however I should point out that the Euro didn't exist before 1 January 1999 and was only used as an accounting currency until 1 January 2002 when the first Euro denominated notes and coins went into circulation to replace the individual Eurozone nations currencies. With such a short history it seems a little over-dramatic for the Washington Post to describe a drop below parity with the dollar as "historic" :-)
Thanks for that inside-info, Chris!
Hi Robert, can you reply specifically as to how you were able to read data from an internet page. Or maybe write another blog page? Is it as simple as creating a filename pointing to a web page? What do you do if there is more than one table on a page? Do you need anything other than SAS Foundation in order to do it? What does the code look like? Thank you
I use 'filename url' in several of my examples, but I don't think I've written anything extensive about it. Here's a link to the official documentation: http://support.sas.com/documentation/cdl/en/lestmtsref/67407/HTML/default/viewer.htm#p103pi2vrzn6qhn1e8alrs01jrb7.htm
The way I've used it, I treat the page as if it is a text file, and then input & parse the information as needed. If there are multiple different tables on a single html page, you might have to get a little imaginative to read them in separately. Of course, it's easiest when the html page is just a single well-behaved csv file or something like that (rather than html code which you have to parse through to find the data).
For other examples, I presented a paper at SAS Global Forum 2013 that included working code for two methods of inputting data from HTML into SAS. The paper, "The Ins and Outs of Web-Based Data with SAS", and all the code are available at http://support.sas.com/rnd/papers/index.html#2013.
Thanks Bill - sounds like just what they were looking for!
It's good for American tourists in Europe!
Japan, too. The dollar's about ¥120 now. It was under ¥80 not too long ago.
Q: What was the exchange rate when the euro was first introduced? Was it 1:1 against US$? I don't remember.
On the federal reserve site I'm using, they have a file for 1990-1999 data, and the first entry for the euro (in their file) is Jan 4, 1999, and the value is 1.1812.
http://www.federalreserve.gov/releases/h10/hist/dat96_eu.htm