If you're using JMP, please read on. This week's tip is from Professor Robert Carver and his popular book Practical Data Analysis with JMP. To read a free chapter and reviews of the book, visit Robert's author page. 
The following excerpt is from SAS Press author Robert Carver and his book "Practical Data Analysis with JMP" Copyright © 2010, SAS Institute Inc., Cary, North Carolina, USA. ALL RIGHTS RESERVED. (please note that results may vary depending on your version of SAS software)
Using JMP to Compare Two Variances
In our earlier discussion of the t-test we noted that there are two versions of the test, corresponding to the conditions in which the samples share the same variance or have different variances. Both in the t-tests and in techniques we’ll see later, we may need to decide whether two or more groups have equal or unequal variances before we choose a statistical procedure. The Fit Y by X platform in JMP includes a command that facilitates the judgment.
Let’s shift back to the NHANES data, and consider the Body Mass Index (BMI) for the adult men and women in the samples. BMI is a measure of body fat as a percentage of total weight. A lean person has lower BMI than an overweight person. We’ll test the hypothesis that adult women and men in the U.S. have the same mean BMI, and before choosing a test we’ll compare the variances of the two populations.
- Return to the NHANES data table; make sure that you’re still excluding and hiding the respondents under 18 years of age.
- Select Analyze > Fit Y by X. Our Y column is BMXBMI and our X column is RIAGENDR1. Click OK.
- Click the red triangle next to Oneway Analysis, and select UnEqual Variances. This opens the panel shown in Figure 10.9.
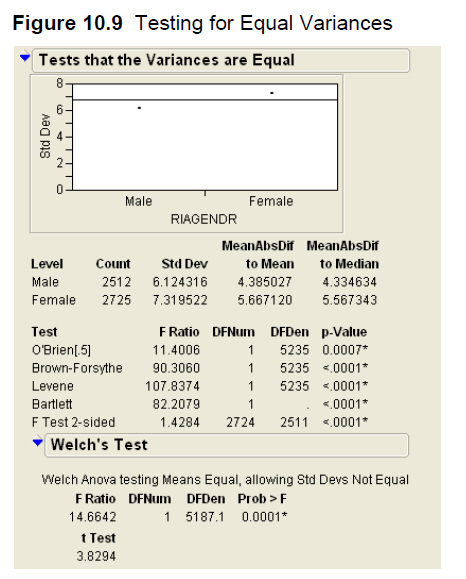
We find a simple graph comparing the sample standard deviations (s) of the two groups, with the numerical summaries below it. For the women, s = 7.32, and for the men s = 6.12. Because the variance is the square of the standard deviation, we can determine that the sample variances are approximately 53.6 and 37.5 respectively. Based on these sample values, should we conclude that the population variances are the same or different?
JMP performs five different tests for the equality, or homogeneity, of variances. Although they all lead to the same conclusion in this particular example, that’s not always the case. For two-sample comparisons the most commonly used tests are probably Levene’s test and the F test two-sided. The null hypothesis is that the variance of all groups is equal, and the alternative hypothesis is that variances are unequal.
In this example, the P-values fall well below the conventional significance level of 0.05. That is, there is sufficient evidence to reject the null assumption of equal variances, so we can conclude that this set of data should be analyzed with an unequal variance t-test. You’ll get the chance to perform the test as one of the Application exercises at the end of the chapter.
1If you want to use sampling weights in the analysis, use the weight column WTINT2YR.


