I've been working with date-time data on a recent project, and I've come across a few SAS programs that have "opportunity for improvement" when it comes time to create reports. (Or maybe I haven't, and I contrived this entire blog post so that I could reference one of my favorite
Tag: SGPLOT
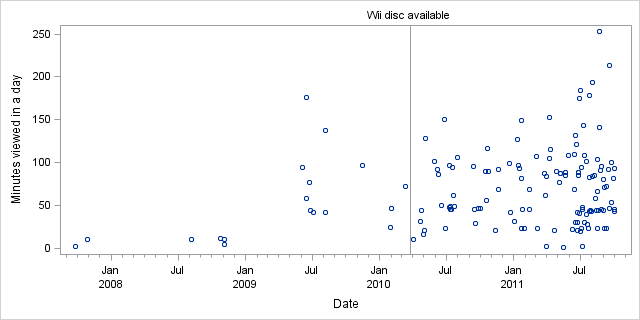
It turns out that I'm not receiving the maximum potential value from my Netflix streaming service. Perhaps it's because I place too much value on sleep. With my monthly subscription, I am permitted to view Netflix content 24 hours a day, 7 days a week. In my house I have
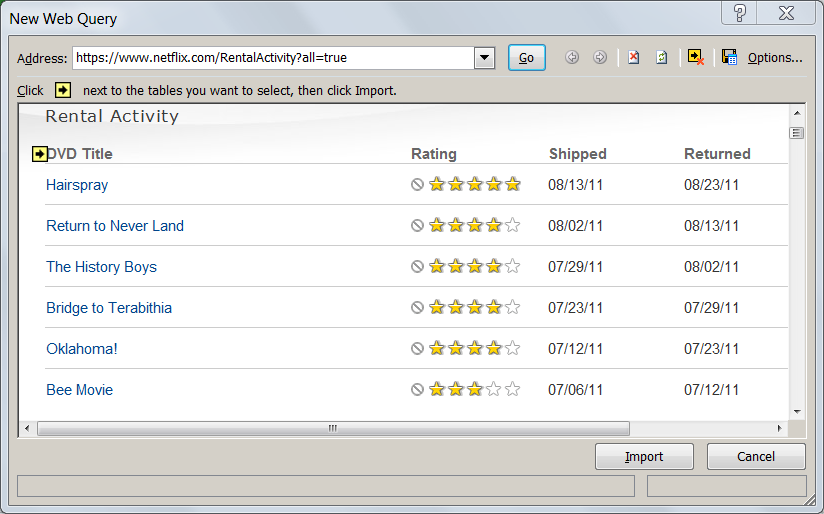
Like millions of other Americans, I recently was asked to make a decision of tremendous importance to my household -- a decision that would affect the welfare of everyone in my family. That decision, of course, was whether to continue to receive Netflix movies by mail, or opt for the
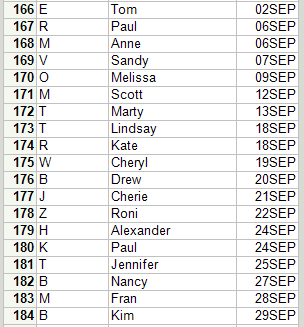
Earlier today, Rick posted interesting information about which time of year the most babies are born, at least in the USA. I don't have data nearly as extensive as what's available at the NCHS, but I do have a sample of birthday records to compare against Rick's findings. My sample
This morning I delivered a talk to visiting high school students at the SAS campus. The topic: using SAS to analyze Twitter content. Being teenagers, high school students are well familiar with Twitter. But this batch of students was also very familiar with SAS, as they all have taken SAS
It's almost 2011, so let's reflect on the top 11 posts (by number of visits in 2010) on this blog. Not all of these posts were written in 2010; in fact, some of these date back to 2007. But apparently they are oldies and goodies. 1. SAS 9.2 and SAS
My family and I attended the North Carolina State Fair on Tuesday (weather was beautiful), and noticed two differences from previous years: Everything was more expensive -- getting in, riding the rides, and especially the food. It was easier to get around, because it wasn't so crowded. We didn't have
Like millions of Americans, I watched the vice presidential debate on television last night. I also watched it on Twitter -- which is to say that while watching the debate, I watched the real-time responses of hundreds of Twitter users. Twitter users, as you may know, have up to 140
Here at SAS, we eat our own dogfood*. Actually, that's an understatement -- it's better to say that we feast on it. I've been using SAS 9.2 (released earlier this year) and SAS Enterprise Guide 4.2 (not yet released) for many months (years, actually) to accomplish several tasks, including to
At SAS Global Forum last week, a customer approached me with a very specific request. The conversation went something like this: Customer: My client demands a bar chart that uses a bar for one response, and a symbol for other responses, all on the same chart. We know it's possible