But since I'm living in SAS these days -- not just the place (at SAS headquarters), but the software -- I decided to see if I could use my SAS tools to "find" some Pokémon in my work. Thanks to PROC HTTP and fantastic service called the Pokéapi, I've managed some success.
Calling the Pokéapi REST API with SAS
PROC HTTP is the the SAS procedure that you can use to call REST APIs. And the Pokéapi site is a REST API that yields on-demand information about our new favorite creatures. Here's a quick example:
/* utility macro to put file contents to SAS log */ %macro echoResp(fn=); data _null_; infile &fn; input; put _infile_; run; %mend; filename resp temp; /* Call the Pokeapi to list all available Pokemon */ proc http url="http://pokeapi.co/api/v2/pokemon/?limit=1000" out=resp method="GET"; run; %echoResp(fn=resp); |
Here's a snippet of my "Pokémon log":

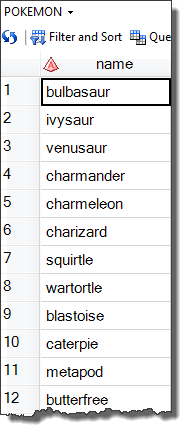
I need a DATA step to read and parse some of the API response, which is in JSON. I'm using a simple INFILE with SCANOVER to parse out just a few bits and create a data set of all the character names (811 of them). The API response is basically one huge line of text, so I'm using the @@ directive to keep the INPUT statement working on the same "record."
data pokemon; infile resp lrecl=65635 scanover truncover; length name $ 20; input @'"name":' name $quote20. @@; run; |
If you're using the free SAS OnDemand for Academics, this code should work there too!

I can also use PROC HTTP and the API to gather an incredible amount of detail about each character. I found Jigglypuff at record 39, so here's my code to retrieve and parse some more details. Note that there are hundreds of attributes available for each character, and I'm pulling just a couple of them.
proc http url="http://pokeapi.co/api/v2/pokemon/39" out=resp method="GET"; run; data jiggly; infile resp lrecl=500000 scanover truncover; length weight 8 base_experience 8; input @'"weight":' weight 2. @@; input @'"base_experience":' base_experience 2. @@; run; |
And the results:
Going to "the source" for raw Pokémon data
Parsing JSON using SAS is fun and all, but sometimes you just want access to the raw data. And it turns out that the Pokéapi folks have a project on GitHub with everything we need. We can use PROC HTTP to get to that too! And then use SAS to join and analyze/visualize the results! These calls are to the GitHub site to access the "raw" view of data files in the repository.
Update 15Jul2016: Since I originally published this post, I've heard from Pokémon experts and data visualization experts. They correctly pointed out that my default PROC FREQ plot did not represent the best of SAS graphics nor Pokémon abilities. I've adjusted my code and republished with these changes:
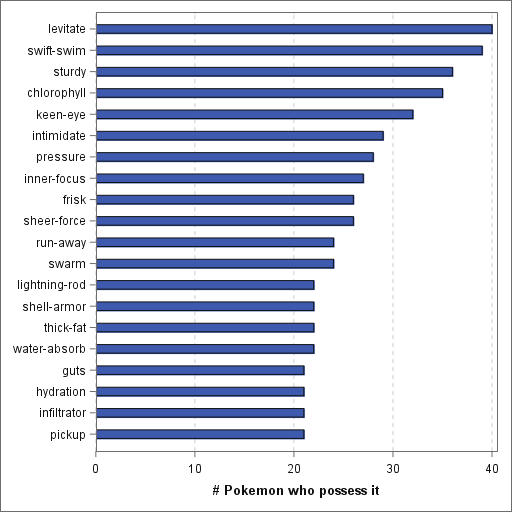
- Used PROC SGPLOT to show the PROC FREQ output with just the 20 most common abilities, instead of cramming ALL abilities into a single chart.
- Added GUESSINGROWS=MAX to my PROC IMPORT steps to ensure variables are assigned the proper lengths. Robert Allison pointed out that some names were being truncated.
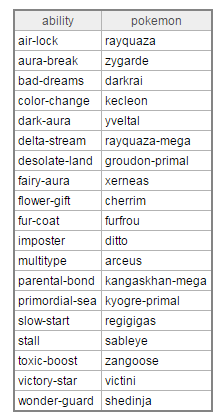
- Added a tabular report of the less-common abilities -- those that show up in just one Pokémon character each.
- Cleaned up the SAS code for readability here, and updated the entire thing on my GitHub Gist.
/* Location of the PokeAPI project on GitHub */ %let githubRoot=https://raw.githubusercontent.com/PokeAPI/pokeapi/master/data/v2/csv; /* temp location for CSV files, works on UNIX or Windows */ %let csvOut = %sysfunc(getoption(WORK)); filename pk_csv "&csvOut./pokemon.csv"; proc http url="&githubRoot./pokemon.csv" method="GET" out=pk_csv; run; proc import file=pk_csv out=pokemon dbms=csv replace; guessingrows=max; run; filename pk_ab "&csvOut./pokemon_ab.csv"; proc http url="&githubRoot./pokemon_abilities.csv" method="GET" out=pk_ab; run; proc import file=pk_ab out=abilities dbms=csv replace; guessingrows=max; run; filename pk_abn "&csvOut./pokemon_abnames.csv"; proc http url="&githubRoot./abilities.csv" method="GET" out=pk_abn; run; proc import file=pk_abn out=abnames dbms=csv replace; guessingrows=max; run; /* Join the 3 data sets */ proc sql; create table work.withabilities as select t3.identifier as pokemon, t1.identifier as ability from work.abilities t2, work.pokemon t3, work.abnames t1 where (t2.pokemon_id = t3.id and t2.ability_id = t1.id); quit; /* Frequency of Abilities among the characters */ proc freq data=work.withabilities noprint order=freq ; tables ability / nocum scores=table out=ability_freq; run; /* Create a more readable plot based on the most common abilities */ ods graphics on / height=800 width=800; title "Most common abilities among Pokemon"; proc sgplot data=ability_freq (obs=20); hbar ability / response=count barwidth=.4; yaxis discreteorder=data display=(nolabel); xaxis label="# Pokemon who possess it" grid ; run; /* Join the FREQ output with pokemon names and abilities */ /* for a report on "rare" abilities */ proc sql; create table rareabilities as select t1.pokemon, t1.ability from withabilities t1 inner join ability_freq t2 on (t1.ability=t2.ability AND t2.count=1) order by t1.ability; quit; title "Rare abilities among Pokemon (each possessed by only one character)"; proc print data=rareabilities noobs; var ability pokemon; run; |
Here's what PROC FREQ and SGPLOT shows about how common some of the abilities are among the Pokémon. "Levitate" appears to be common (good thing, because I'm not sure that they all have legs).

And the table of less common abilities and who has them? Simple to show with PROC PRINT. I see that "slow start" is uncommon (but that's an ability that I think I can claim for myself...).

Full code: I placed all code presented here in a public Gist on GitHub. Enjoy!


5 Comments
Your last graph demonstrates a common data visualization problem. You have dozens of discrete categories, but only 600 pixels to display them. By default, PROC SGPLOT will thin the categories. For 30 or 50 categories you can try to see them all by (1) Making the graph taller, (2) Making the font smaller, and (3) Use FITPOLICY=NONE. For more than 50 categories you can thin (as you've done) or create a plot that shows most frequent categories while grouping the less frequent categories into an "Others" category.
Thanks Rick! I saw the limitations, but was rushing to get something published in this crazy PokemonGO news cycle! I might come back with improvements.
There - fixed! Well, at least the chart looks better. I'm sure that there are many more interesting visualizations possible, especially if we pulled in more data...
Pingback: Pokémon: Gotta graph 'em all! - SAS Learning Post
Pingback: Is "La Quinta" Spanish for "Next to Denny's"? - The DO Loop