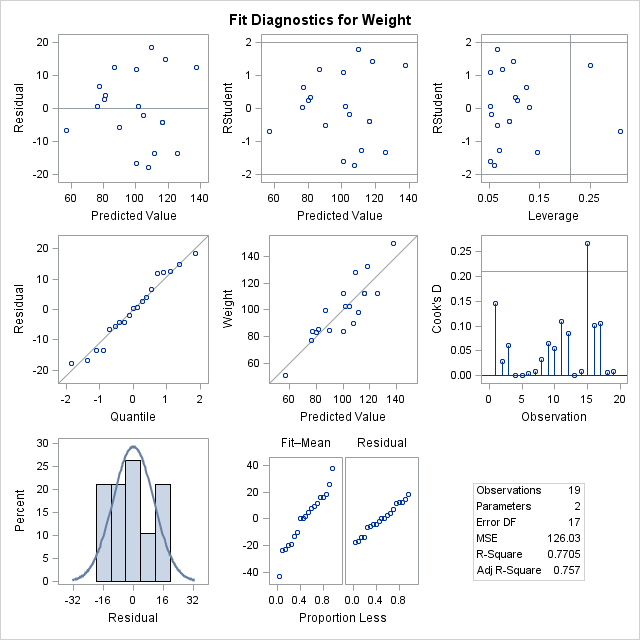
One of the great innovations with SAS 9.3 is the focus on ODS statistical graphics.
"Wait a minute," you're thinking, "weren't ODS graphics added in SAS 9.2?"
Yes, that's true. But with SAS 9.3 there is even more capability: more analytical SAS procedures support the graphs, and there are more features in the specialized graph procedures such as SGPLOT.
But even more remarkable is the change in SAS display manager to bring ODS graphics into focus. Now HTML output (not text listing) is the default output from SAS display manager. And a new ODS style, named "HTMLBlue", has been designed to show the graphs in a crisp and colorful way.
If you are using SAS Enterprise Guide 4.3, you don't have HTMLBlue in your list of available styles. But you can add it with a few simple steps.
1. Use SAS to create a copy of the HTMLBlue stylesheet.
filename out temp; /* change the location of the css fileref as necessary */ filename css "c:\temp\htmlblue.css"; ods html file=out style=htmlblue stylesheet=css; proc print data=sashelp.class; run; ods html close; |
You can run this code in a SAS window or in SAS Enterprise Guide, making sure that you are able to write to the location that the CSS fileref is mapped to. After running the program, the htmlblue.css file will appear in the location specified in the program.
2. Copy the htmlblue.css file to the Styles subfolder in your SAS Enterprise Guide application directory.
Depending on how you installed SAS Enterprise Guide, that location might be:
C:\Program Files\SAS\EnterpriseGuide\4.3\Styles
or
C:\Program Files\SASHome\x86\SASEnterpriseGuide\4.3\Styles
3. In SAS Enterprise Guide, change the preferences for your results output to use the new HTMLBlue style.
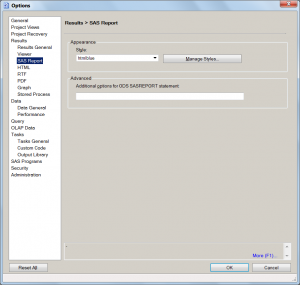
The style will automatically appear in the list of available styles. For example, to change the default output for SAS Report, select Tools->Options->Results->SAS Report, and select "htmlblue" from the list of styles.
And even though the style is named "HTMLBlue", you don't have to use it for just HTML. It's just as attractive when using SAS Report. Of course you can also use it for RTF and PDF output as well, although you might prefer a cleaner style such as Journal for printed output. The SAS OnlineDoc for statistical graphics contains a comparison of the various styles, with considerable focus on the details for the graphics.


3 Comments
Is the .css available anywhere publicly for us to use with 9.2 if we can't migrate yet?
Jen, here's a copy for you: http://support.sas.com/documentation/onlinedoc/guide/blog/htmlblue.css.
If you follow the steps I've described, HTMLBlue will appear in your list of styles. BUT, because there is not HTMLBLUE style defined as an ODS style template, using the style will generate a warning. ("No style named HTMLBLUE")
For HTML and SAS Report, the tables will have the HTMLBlue look. But the ODS Graphics will not, because those definitions are baked into the 9.3 version of the ODS style template.
Pingback: Traffic report: the most visited posts of 2011 - The SAS Dummy