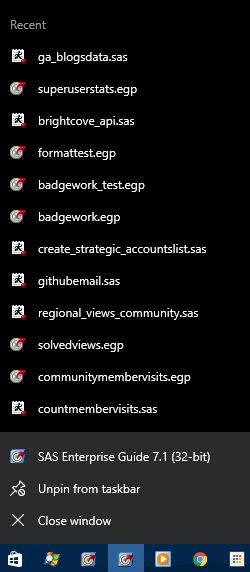
You can use a range attribute map to control the mapping of values in a continuous variable to colors. This post shows you how to use PROC SGPLOT to display multiple plots in the same graph and use range attribute maps.
The role of analytics in combating terrorism Earlier this spring, I found myself walking through a quiet and peaceful grove of spruce trees south of the small hamlet of Foy outside of Bastogne, Belgium. On travel in Europe, I happened to have some extra time before heading to London. I
The new government’s vision of Brexit is to make the UK a more international, more outward looking nation. One whose future success and status in on the world stage will be dictated by the ability to attract investment and finance, and to drive trade with existing and new partners. Yet