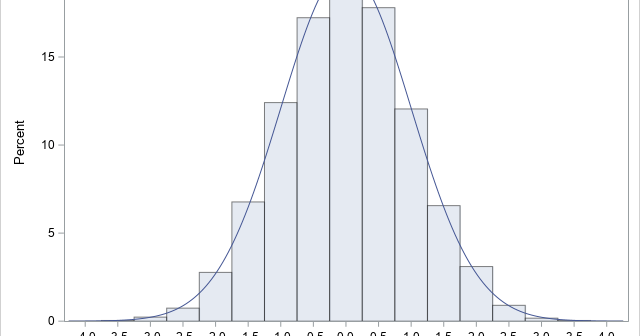
With four parameters I can fit an elephant. With five I can make his trunk wiggle. — John von Neumann Ever since the dawn of statistics, researchers have searched for the Holy Grail of statistical modeling. Namely, a flexible distribution that can model any continuous univariate data. As the quote
Author
In statistical quality control, practitioners often estimate the variability of products that are being produced in a manufacturing plant. It is important to estimate the variability as soon as possible, which means trying to obtain an estimate from a small sample. Samples of size five or less are not uncommon
In a recent Monte Carlo project, I needed to simulate numbers on an interval by using a continuous linear probability density function (PDF). An example is shown to the right. In this example, the linear density function is decreasing on the interval, but the function could also be constant or
I read a journal article in which a researcher used a formula for the probability density function (PDF) of the sample correlation coefficient. The formula was rather complicated, and presented with no citation, so I was curious to learn more. I found the distribution for the correlation coefficient in the
Some hearts are famous. For example, there is the "Heart of Gold" (Neil Young), the "Heart of Glass" (Blondie), and the Heart of Darkness (Joseph Conrad). But have you heard of the "Heart of Ellipses"? No? Well, in 2023, Ted Conway published an amusingly titled article, "Total Ellipse of the
This article looks at a geometric method for estimating the center of a multivariate point cloud. The method is known as convex-hull peeling. In two-dimensions, you can perform convex-hull peeling in SAS 9 by using the CVEXHULL function in SAS IML software. For higher dimensions, you can use the CONVEXHULL
A SAS programmer wanted to find the name of the variable for each row that contains the largest value. This task is useful for wide data sets in which each observation has several variables that are measured on the same scale. For example, each observation in the data might represent
A colleague remarked that my recent article about using Jacobi's iterative method for solving a linear system of equations "seems like magic." Specifically, it seems like magic that you can solve a certain class of linear systems by using only matrix multiplication. For any initial guess, the iteration converges to
In a first course in numerical analysis, students often encounter a simple iterative method for solving a linear system of equations, known as Jacobi's method (or Jacobi's iterative method). Although Jacobi's method is not used much in practice, it is introduced because it is easy to explain, easy to implement,
There are two popular ways to express the steepness of a line or ray. The most-often used mathematical definition is from high-school math where the slope is defined as "rise over run." A second way is to report the angle of inclination to the horizontal, as introduced in basic trigonometry.