A SAS programmer was trying to implement an algorithm in PROC IML in SAS based on some R code he had seen on the internet. The R code used the rank() and order() functions. This led the programmer to ask, "What is the different between the rank and the order? Furthermore, does the SAS IML language contain an equivalent to the order() function in R?" This article explains the difference between rank and order and how they relate to the sorted order of data. In the SAS IML language, the SORTNDX call is equivalent to the order() function in R.
For clarity, this article assumes that the data do not contain any tied (duplicate values). For simplicity, all sorts are assumed to be in ascending order.
Ranks and sort order
Ranks are related to the sort order for a set of values. The smallest value is ranked 1, the next smallest is ranked 2, and so on. This is the "race ranking," where the athlete with the smallest time wins first place; the largest time is considered last place. (Golf also rewards low scores.) Mathematically, you sort the data values in ascending order and assign the rank as the ordinal position of the sorted data. If there are no tied values, the rank is unique.
For example, in the data {75, 88, 82, 94, 68}, the corresponding ranks are {2, 4, 3, 5, 1} because 68 is the first (sorted) value, 75 is the second (sorted) value, and so forth. For n unique values, the ranks are integers in the range [1,n].
In SAS you can use the RANK procedure to assign ranks. In the SAS IML language, the RANK function supports the same functionality.
proc iml; /* for clarity, assume no tied values */ x = {75, 88, 82, 94, 68}; /* what is the sorted order? Copy x to s, then sort, so that x is not overwritten */ s = x; call sort(s); /* RANK is the order in which the values appear if you sort them. The smallest value gets rank=1; the largest gets rank=N. */ rank = rank(x); position = T(1:nrow(x)); print position x rank s[L='sort(x)']; |
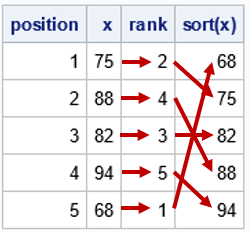
For each observation in the data, the table shows the position (observation number), the data value, and the rank. The last column is the vector of sorted data values. I added arrows to visualize how the rank works. For each value, you look at the corresponding rank. That tells you the row of the last (sorted) column in which the value will appear when you sort the values in ascending order.
Sort indices
The order() function in R returns what I call the "sort indices." These are also called the "anti-ranks" or the "inverse ranks" because they represent the inverse operation for the ranking process. You start with the data in sorted order. You then ask, for each sorted value, what was the original position of that value. This is the sort index.
For example, in the data {75, 88, 82, 94, 68}, the sorted order is {68, 75, 82, 88, 94}. The first sort index is 5 because the first sorted value (68) was originally in the 5th position. The second sort index is 1 because the second sorted value (75) was originally in the first position. In the SAS IML language, you can use the SORTNDX subroutine to compute the sort index, as follows:
/* the sort index is the vector of indices, ndx, such that x[ndx] is sorted. This is equivalent to the order() function in R. */ call sortndx(ndx, x); print position x ndx s[L='sort(x)']; |

The table shows the position (observation number), the data value, and the sort index. The last column is the vector of sorted data values. Again, I added arrows to visualize how the sort index works. Note that the arrows now move from the right to the left. For each sorted value, you look at the corresponding sort index. That tells you the row (observation number) of the data value in the original order.
Sorting by using the rank or sort index
Both the rank and the sort index enable you to sort the data. This is most easily seen by considering the sort index. If ndx is a vector that contains the sort index for the vector x, then x[ndx] is the sorted vector. This is why the name "sort index" is used: it is the vector of indices that sorts the data.
You can also use the rank to sort the data. However, you need to use the rank on the left-hand side of an assignment statement! That is, if y is a vector that is the same dimension as x and if r is the vector of ranks, then the assignment y[r]= x puts the sorted values of x into the vector y. The following SAS IML statements show both techniques for sorting the data.
/* the sort index sorts the data when it is used as a subscript on the LHS */ z = x[ndx]; print x ndx z[L='x[ndx]']; /* the rank sorts the data when it is used as a subscript on the RHS */ y = j(nrow(x),1,.); /* y is the same size as x */ y[rank] = x; print x rank y[L='y[rank]=x']; |
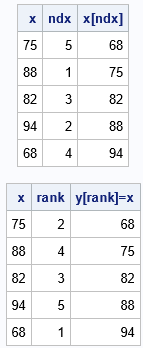
For both tables, the last column shows the data in (ascending) sorted order. The first table used the expression x[ndx], where ndx is the sort index. The second table used the assignment y[r]=x, where r is the rank of x.
Summary
There are two ways to express the permutation that transforms a data vector into a sorted vector. The sort index (also called the anti-rank or inverse rank) is the vector of indices that sorts the data. The rank is the position of each element after sorting the data in ascending order. The sort index and the rank are inverse operations. In the SAS, you can use the SORTNDX subroutine to compute the sort index. You can use the RANK function to compute the ranks. The SORTNDX subroutine is equivalent to the order() function in R.

2 Comments
I have recently picked up data analysis and visualization with Python and JavaScript, and I'm enjoying the learning process. But I haven't started working with R yet. Is the R programming language generally preferred to Python and/or JavaScript for computing statistics, data analysis and data visualization applications?
It depends who you talk to. MATLAB and Python are taught in computer science and engineering departments. SAS and R are taught in statistics and data analytics departments. I don't think many professional data analysts would state that they prefer JavaScript.