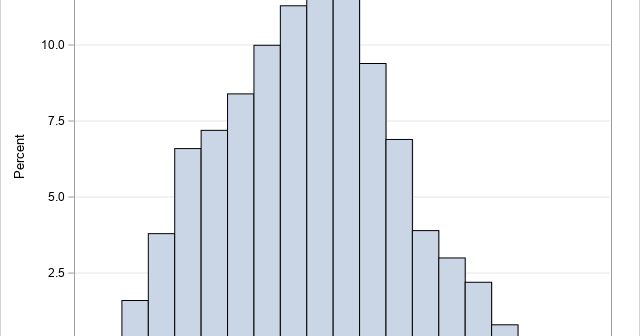
The noncentral t distribution is a probability distribution that is used in power analysis and hypothesis testing. The distribution generalizes the Student t distribution by adding a noncentrality parameter, δ. When δ=0, the noncentral t distribution is the usual (central) t distribution, which is a symmetric distribution. When δ >
Author
A common question on SAS discussion forums is how to use SAS to generate random ID values. The use case is to generate a set of random strings to assign to patients in a clinical study. If you assign each patient a unique ID and delete the patients' names, you
I recently showed how to represent positive integers in any base and gave examples of base 2 (binary), base 8 (octal), and base 16 (hexadecimal). One fun application is that you can use base 26 to associate a positive integer to every string of English characters. This article shows how
An integer can be represented in many ways. This article shows how to represent a positive integer in any base b. The most common base is b=10, but other popular bases are b=2 (binary numbers), b=8 (octal), and b=16 (hexadecimal). Each base represents integers in different ways. Think of a
Monotonic transformations occur frequently in math and statistics. Analysts use monotonic transformations to transform variable values, with Tukey's ladder of transformations and the Box-Cox transformations being familiar examples. Monotonic distributions figure prominently in probability theory because the cumulative distribution is a monotonic increasing function. For a continuous distribution that is
The SELECT-WHEN statement in the SAS DATA step is an alternative to using a long sequence of IF-THEN/ELSE statements. Although logically equivalent to IF-THEN/ELSE statements, the SELECT-WHEN statement can be easier to read. This article discusses the two distinct ways to specify the SELECT-WHEN statement. You can use the first
A SAS programmer was trying to understand how PROC SGPLOT orders categories and segments in a stacked bar chart. As with all problems, it is often useful to start with a simpler version of the problem. After you understand the simpler situation, you can apply that understanding to the more
A SAS programmer asked how to display long labels at irregular locations along the horizontal axis of scatter plot. The labels indicate various phases of a clinical study. This article discusses the problem and shows how to use the FITPOLICY=STAGGER option on the XAXIS or X2AXIS statement to avoid collisions
A SAS customer asked how to use the Box-Cox transformation to normalize a single variable. Recall that a normalizing transformation is a function that attempts to convert a set of data to be as nearly normal as possible. For positive-valued data, introductory statistics courses often mention the log transformation or
In the 1960s and '70s, before nonparametric regression methods became widely available, it was common to apply a nonlinear transformation to the dependent variable before fitting a linear regression model. This is still done today, with the most common transformation being a logarithmic transformation of the dependent variable, which fits