This is the second article in a three-part series on how to reduce uncertainty in the supply chain for lower costs. The first was about reducing uncertainty downstream.This article deals with reducing uncertainty within the company.
There are several ways to define uncertainty. I like two angles on uncertainty (which are not that different):
- Supply chain uncertainty refers to the decision-making process in the supply chain in which the decision maker does not know definitely what to decide due to lack of transparency into the supply chain and the impact of possible actions.
- Supply chain uncertainty refers to the change of the balance and profitability of the supply chain caused by potential and unpredictable events that requires a response to re-establish the balance. An event can be an unexpected order, late delivery from a supplier or a breakdown of critical production equipment.
As you will see in the following three examples, the data for analytics to reduce internal uncertainty is available. It is most often already available within the company and may just need preparation.
Uncertainty: What should I put on inventory
Inventory is a buffer to withstand unforeseen variation (uncertainty) within supply and demand. Further, internal buffers are often used to make key equipment (bottlenecks) run continuously. On the other hand, inventory = cost, and inventory is often regarded too high.
The supply chain should be responsive to true demand, keeping a high customer service level.
As with forecasting, I have written several posts on how to manage inventory levels – from supply chain optimisation to visualising inventory levels to identify the “living dead stock.”
The best answer to the inventory question is to continuously optimise inventory based on a solid forecast. This way, inventory reflects demand and the uncertainties of both demand and supply. However, the inventory optimisation model should not just reflect demand and demand uncertainty, but also uncertainties on the supply side. Sometimes vendors deliver late; sometimes the quality is lower.
In order to make a good optimisation model, it is necessary to constantly review why inventory is not in sync with the supply chain (too high or too low). Seeking explanations to these cases will reveal the uncertainties that the optimisation model needs to handle. Next is to identify data sets to support the model – these are typically available in the ERP system, e.g., late deliveries or quality issues.
Uncertainty: When should I perform maintenance on my production equipment
“Anything that can go wrong will go wrong – at the worst possible time.”
Murphy’s Law has many applications, and one of them is in manufacturing, where a machine is most likely to break down during times with high load, i.e., when it is most crucial that it works. It will create a shortage of products downstream, potentially leading to lower customer service.
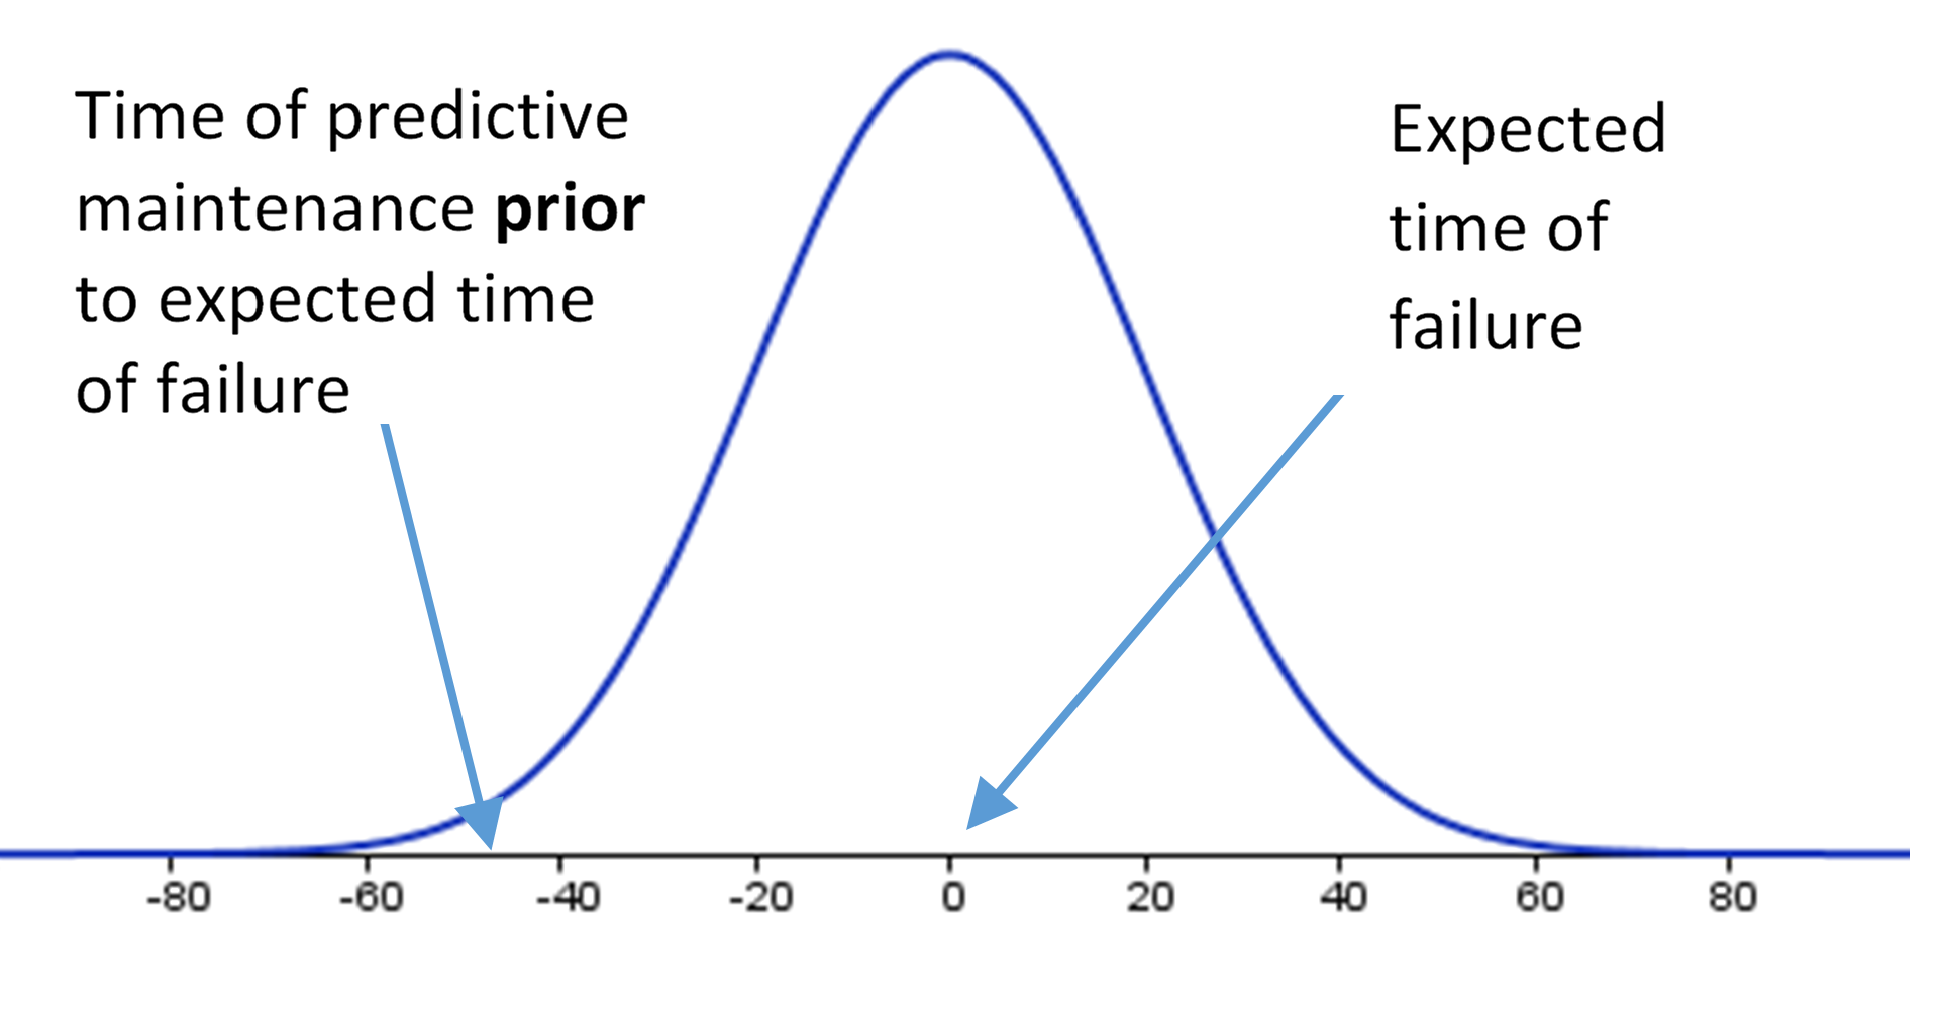
Often, companies have a preventive maintenance schedule, where maintenance is triggered based either on a time schedule or when certain events happen. It relies on expecting (forecasting) when the production equipment is likely to fail due to wear.
Adding analytics, predictive maintenance is an upgrade to preventive maintenance that can significantly improve equipment performance.
More and more production lines are equipped with sensors that measure information about the equipment, the process or the material. The reason is to automate processes, alert operators to significant or unexpected events, and gather data to monitor and measure machine performance.
A thorough analysis of sensor data in relation to data from historical breakdowns can reveal more complex patterns, so instead of just reacting to one sensor reading, you can react to readings across several sensors. This will allow earlier detection and intervention before the equipment malfunctions. By moving from a forecasted point in time to real-time analysis of system behaviour, equipment running time will be greater.
Data for maximising equipment performance is naturally sensor readings from the production line and data from breakdowns. Initial analysis is done on data at rest to find historical patterns, then asset performance analytics models can be run on streaming data afterwards.
Uncertainty: Will the product I’m producing now pass quality tests
In my previous post on downstream uncertainty, I wrote about quality as experienced by the customer. Here we used claims, streaming data or social media to identify quality problems (whether real or perceived).
While it is better to identify problems in-house, scrapping components or finished goods due to poor quality is still costly, and scrapping late in the production chain (final tests) will require additional capacity to produce a new product. This puts additional pressure on the production line.
The cornerstone of quality analytics is identifying root causes for producing low quality. Whether this calls for statistical analysis, predictive analytics or even artificial intelligence depends on the available data and production line.
The data for this is typically found in-house in the ERP, MES or other system. In some cases, additional data may be required to build a good model. This may require additional sensors be set up on the production line to collect data.
The bottom line
The bottom line is that the cost associated with uncertainty internally in the factory decreases when you apply analytics to already available data. For the two latter examples, the key is to bring together analytical competencies with knowledge of the manufacturing process. Analytics without domain knowledge will not lead to improvements.
In the table below, the three examples are summed up, outlining data, analytics methods and value gained.
Discover more insights on SAS Industrial IoT Information Hub


