Tips and Tricks
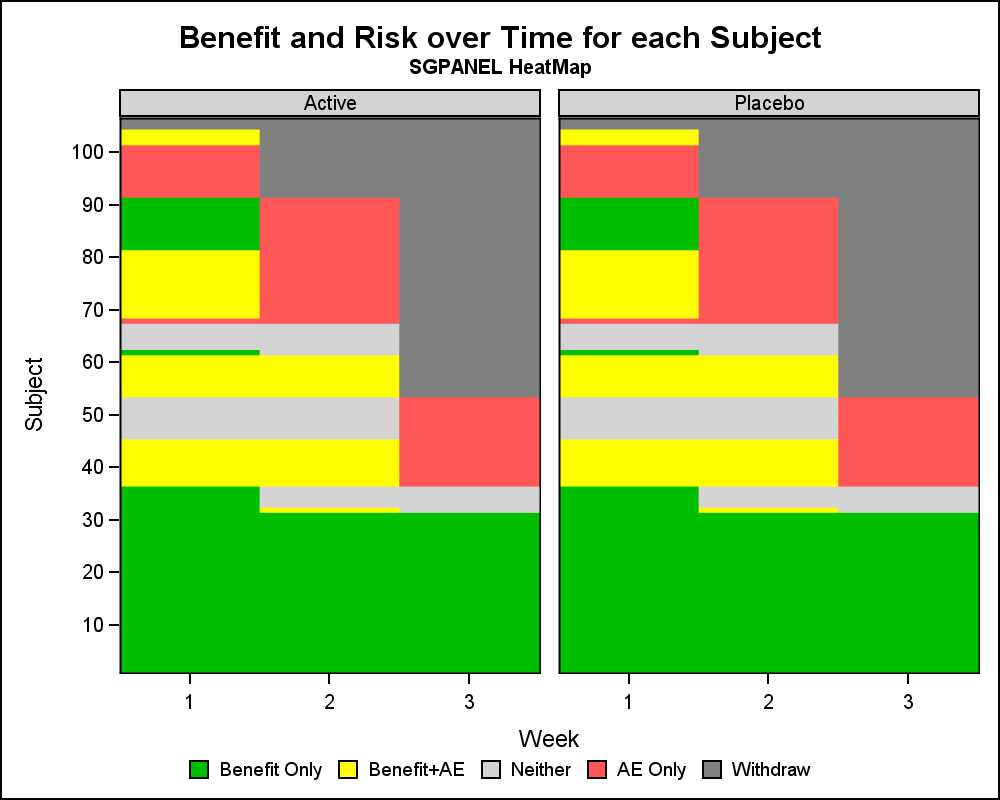
CTSPedia Clinical Graphs - Heatmap of Benefit

Let us continue our review of the Clinical Graphs included in the CTSPedia repository. Today, I noticed this Heatmap of Benefits and Risks over Time for Subjects in a study by Treatment, submitted by Max Cherny using "R" code. I thought it would be a good exercise to see how to build this