Gartner has stated that there are nearly five billion connected devices throughout the world today and predicts that there will be more than 25 billion by 2020, making the potential of this technology unlimited. The connected devices in industrial settings, in personal devices, and in our homes are creating a great potential for improving business outcomes and enhancing personal lives. Many companies have defined strategic plans for collecting and exploiting the data coming from these connected devices. We are at the onset of a revolution due to this new internet of things (IoT) reality. Exploiting the value in all these connected devices requires new tricks of the trade to deal with unique issues such as capturing the right amount of data in the right aggregations, building statistical models to capture stable system operations, and being able to score these models on streaming data to create alerts for degradations or upcoming failures. Multi-stage modeling is one way to ensure you get the return on investment out of the IoT. Building multi-stage models means your predictive analytical models run in the cloud and update with the data streaming in, impacting a wider set of decisions more rapidly, more frequently, and more automatically.
IoT is the new frontier in scale, speed, and predictive modeling for analytics. From the collection of the data, to streaming data analytics, to big data analytics in the cloud, IoT is destined to change the way we manage our information: from health and fitness to the maintenance of large capital industrial equipment in oil and gas, energy, transportation, and manufacturing. Many industrial use cases involve early detection of system degradation and then optimizing predictive maintenance to avoid costly down times.
To make the scale of the data off the stream concrete, consider the commercial airplanes of today. A typical airplane currently has ~ 6000 sensors and creates 2.5 terabytes of data per day. By 2020, this number may triple or quadruple to over 7.5 terabytes. Such planes generate an enormous amount of data, which is a good thing, since analytics based on these data will likely allow us to detect aircraft issues before a life threatening problem manifests and/or before major damage to expensive parts occur that would cause costly downtime. These are very sophisticated machines with high availability expectations that are costly to build, fly, repair, etc. Any intelligence that can be gained from multi-stage modeling to avoid problems proactively can generate huge ROI.
Event stream processing (ESP) enables real-time analytics from the data streaming in on the edge, meaning right at the point of capture, as opposed to data that has been accumulated and sent to the cloud. ESP therefore allows for analysis, filtering, and aggregation of sensor or machine data much closer to the occurrence of events and offers low latency. The ability to filter and aggregate event data on the edge is critical, given that the incoming volume will likely be too large to go to feasibly process in the cloud. Also, analyzing event data on the edge in sub-second timeframes enables opportunities otherwise lost due to latencies associated with analyzing it in the compute cloud. Multi-stage modeling is modeling on the edge, in the cloud, and/or wherever makes the most sense for the situation.
New analytical models for high-frequency machine (or sensor) data analysis will enhance the value created by ESP and enable that all-important ROI. Analytics answers questions about which sensor(s) give us predictive power, which aggregations need to be kept for in-depth modeling, whether we should keep the original sensor data or a transformation of it (change, lag, etc.), and whether we have an early indicator of degradation to come. Given the huge volumes of data, intelligent dimension reduction is one of the preliminary steps adding analytical value.
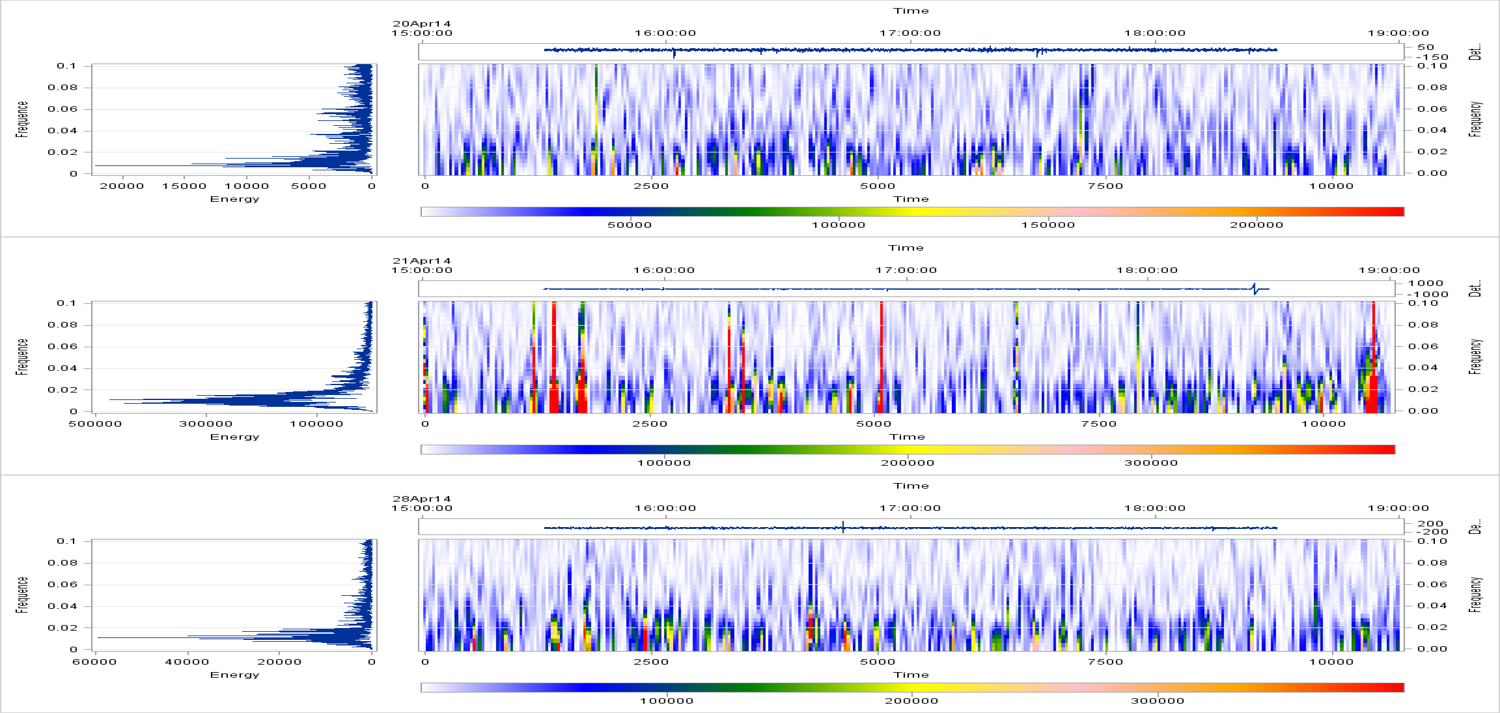
Working with customer data from industries like oil and gas, manufacturing, automotive, energy, and health wearables has allowed my team to develop new methods to exploit the value coming from streaming data. For example, we have developed unique extensions to principal components, singular value decomposition, stability monitoring, optimal lag detection, and time frequency analysis for data that are timestamped every (sub)second-every minute, with hundreds of variables (sensors) and unique events and modes of failure. For example, the plot above shows short-time Fourier transform of voltage the day of the failure compared to the day before and a week after (click the image to enlarge). We focus our research on multi-stage modeling we can score with the streaming data. Although we can capture the models of a ‘stable’ system in the history, we need to be able to identify alerts or degradations on the data that is streaming in.
I’ll be talking more about multi-stage modeling at the SAS Analytics 2015 Conference in Rome in November. If you’ll be there I welcome you at my talk on The Power of Advanced Analytics Applied to Streaming Data.