➤ DISCLOSURE!
No matter what your profession, political leanings or environmental philosophy, “drill, baby, drill” may be the slogan for you. In this post, I’m going to show you how to use SAS to “drill down” as it relates to the Earth’s surface or its model to be precise. We are going to drill down through Google maps.
Exploring the map
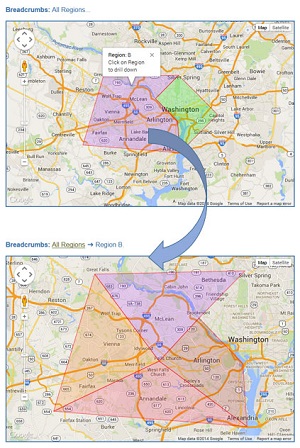
 Before we dive into the how-to of the Google maps drill down, let’s experience first-hand what we are going to achieve. Click on the image on the right, and you will be presented with an interactive Google map with a couple of regions shown in different tints. You can mouse over the region to display some information about those regions.
When you click on the region, you will be effectively drilling down on that region and will be presented with a second level of the Google map. The map will display subregions with relevant information about them available with a single click.
As helpful with drill-down applications, you’ll see the breadcrumbs right above the map. Breadcrumb trails serve two functions: showing where in the drill-down path you are located, and providing navigation back to previous levels.
Please take a minute to explore this Google map interaction before reading further.
The implementation technique and why I chose it
As you interacted with the above demo, you may have assumed there was some data query running behind the scenes to bring in the next drill-down level. Although that technique is a possibility, I implemented it more simply.
For each region shown on Level 1, I created a separate HTML output files for Level 2 regions so that when you click on a region or on a link in the breadcrumbs, the application just loads the appropriate HTML file into your browser. Sound too simple? But that is essentially what you do when implementing OLAP applications—you calculate different levels and their combinations, store them and navigate between them.
If the data pertaining to different levels of the drill-down paths does not change frequently, why run the same query over and over again when you can run it once, create your HTML outputs and just navigate between them as needed. This method is much more efficient from the SAS programming standpoint, and it is fast and transparent for the end users who will most definitely appreciate very short response time of such an application. Besides, the HTML files can be automatically re-created on schedule, for example, daily.
Understanding the code
You can view and download the full sample SAS code. Here are explanations and clarifications for selected code sections in this example:
- Specify output file destination for Level 1. We use the following file name: gmap_drill_lev1.html.
- Prepare the data. Here we prepare the data for both Level 1 and Level 2 maps.
- Create the Level 1 map. This step is very similar to the Drawing overlays on SAS-generated Google maps, with exception of creating a different event listener for a “click” action.When a user clicks on the polygon region, a clicked-on-region event listener in the application opens another HTML file (which was created for the region on the Level 2 of the drill-down) in the same browser window. Opening a closer view map in the same window creates a user experience of zooming in.
/* link to the level-2 map when clicked on region */
'google.maps.event.addListener(mypoly' i ', "click", function() {' /
'window.open("gmap_drill_lev2_' region_lev1 +(-1) '.html", "_self")' /
'});'
There are two more events for which we create event listeners in this step—hovering and moving out of the region:
/* display info window when mouse hovers over region */ 'google.maps.event.addListener(mypoly' i ', "mouseover", function() {' / 'infowindow' i +(-1) '.open(map);' / '});' / /* remove info window when mouse moves out of region */ 'google.maps.event.addListener(mypoly' i ', "mouseout", function() {' / 'infowindow' i +(-1) '.close();' / '});' / - Create Level 2 maps. I wrapped this whole section into the SAS macro create_level2 to have a %do loop encompassing multiple data steps while creating Level 2 HTML outputs. Here, for each region of the Level 1, I create a Level 2 HTML output with a number of subregions.
- Create breadcrumbs. Section 4.7 of the code example shows how to place an active hyperlink to the upper level, gmap_drill_lev1.html:
'<p><b>Breadcrumbs:</b> <a href="gmap_drill_lev1.html" title="Click here to go back up">All Regions</a> ➜ Region ' "®ion_lev1" '.</p>' /
As you can see, SAS turns out to be very effective for generating these multiple HTML output files. The code is completely data-driven, and the same SAS code can be used for any number of Level 1 regions and Level 2 subregions (only data changes). If you ever need Level 3 or deeper levels of the drill-down path, they can be added in a similar manner as you did for Level 2.
Do you find this post useful? Does it provide a solution to your needs or answer any of your questions? Does it give you new ideas for solving your business problems? I would love to hear back from you. Please do not hesitate to comment below.

4 Comments
Great article.
This looks awesome, I look forward to giving it a try!
Leonid,
Great title and lead in sentence; gotta admit that they sucked me in. And, of course, the article was good, too. Thanks!
----MMMMIIIIKKKKEEEE
(aka Michael A. Raithel
Awesome…as always. I love all the work you've done uncovering the power of SAS integrated with Google Maps.
Thanks again and keep posting!!