Discovery Channel's Shark Week starts July 5, 2015 - and I've created a special SAS map & graph of shark attacks in North Carolina to get you in the mood for their week of shark education!
But first, to get you in the mood for my blog, here's a picture of my friend Kirk, posing for a "shark bite" picture on his boat (note that no sharks were harmed in the making of this picture, lol). Captain Kirk is a lot of fun, and you should go fishing on his boat if you're ever visiting Marco Island Florida!
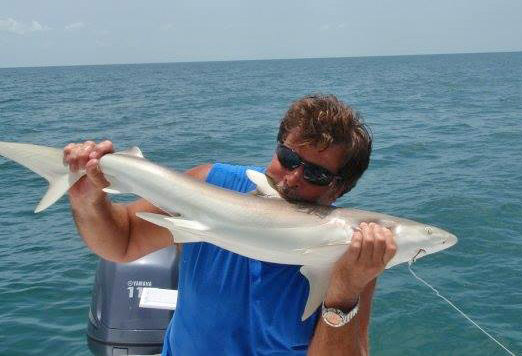
As you probably guessed, the picture above isn't the typical kind of "shark bite" - it's usually the other way around (ie, a shark biting a person). For example, two children recently each lost an arm in shark attacks at two different North Carolina (NC) beaches on the same day (June 14, 2015). This kind of event seemed rare to me, but I knew I should check the data before jumping to conclusions...
So check the data I did! I first found a list of NC shark bites in an article on the WRAL news site. But it was just a list, and you had to expand each one to see a couple of lines of summary data. I went to one of the sources they listed (the Global Shark Attack File), and downloaded their incident log, and imported it into SAS.
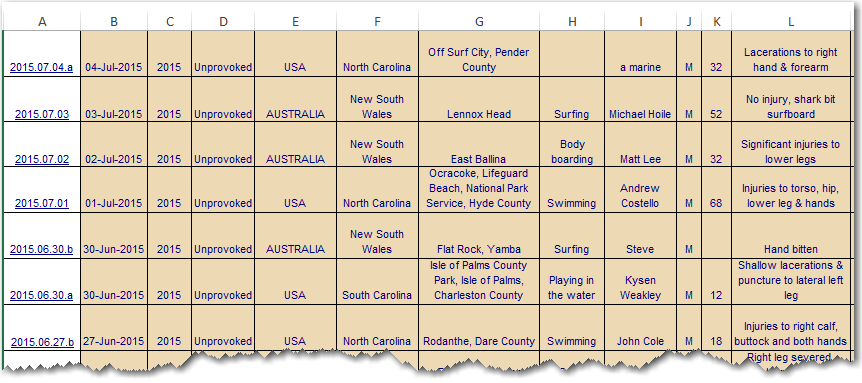
I then filtered it to just NC, and standardized some of the location names so that I could geocode them (ie, estimate the latitude/longitude with Proc Geocode), and then hard-coded the lat/longs for some of the locations that weren't cities. After all the data preparation, I was able to plot them on a map!
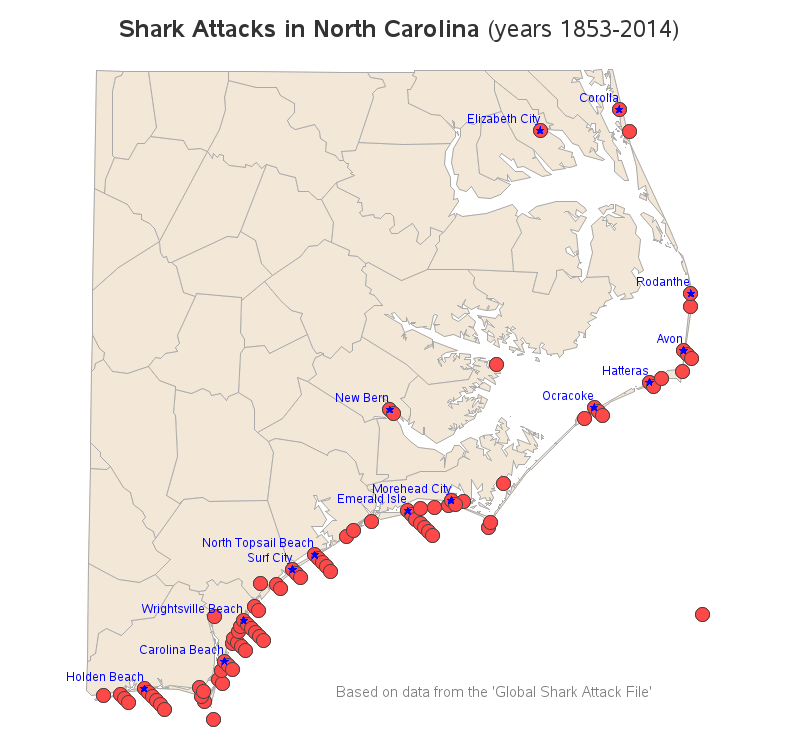
To me, the data is so much easier to comprehend when you can see it on a map. And if you click on the map image above, it will take you to the interactive version of the map, and you can hover your mouse over each marker and see some summary information (date & location), and click on the markers to see the detailed report on each incident. I found it very interesting to read about the shark attacks - especially the really old reports from the 1800s and early 1900s.
If you'd like to see even more shark graphs, check out my blog post from last year, Oh buoy! It's time for some Shark Week graphs!
So, what's your shark story? Have you ever had a "close encounter" with a shark? How did it turn out? (Feel free to leave a comment to share your story!)

9 Comments
Robert -- fun/great idea. I've had a few encounters with sharks -- both catching some 9 miles offshore from Daytona Beach as well as having them swim in the surf next to beach. In fact, our neighboring town, New Smyrna Beach, is supposedly the shark bite capital of the world! How difficult would it be to see a similar graph using Florida data or just data from Volusia County, FL?
Jarrett - you're like a shark magnet (remind me not to go to the beach with you! LOL)
With Florida having so many shark bites, it would be a bit of work to create a Florida map. For each shark bite, I have to manually determine a 'city' name that SAS can geocode, or manually geocode/guesstimate the lat/long based on the description of the incident. Unfortunately it's really quite a bit of work, due to the way the location data is recorded in a textual way in the incident reports.
Nice map! Could you add or do a map from 2015 data. We have had 7 shark attacks out here this season. I would love to see if there is anything to the timing and location. Thanks!
The main thing keeping me from adding this year's (2015) shark attacks is the the website that hosts the pages with all the details (sharkattackfile.net/) hasn't set up pages for the 2015 NC attacks yet. Also, it might be misleading to plot the data for a partial-year (6 months of 2015) in the bar chart after the map - might be best to wait until the end-of-year totals are in.
Robert. Shouldn't the header for the third graphic (the by-date table) read 1853 to 2014, rather than 1975-2014?
Ahh yes - the table inherited the title from the graph above it.
Thanks, I've fixed it now!
Rumor has it that shark attacks are greatest at dawn and dusk. It would be nice when looking at the graph to have some idea as to the time the attacks occurred to see if this rumor is true.
Accounts numbered 86 and 87 appear to be duplicates of the same incident. Thank you for adding the links to the stories; fascinating!
Great attention to details in the reports Lynneth - perhaps it would be good to report this to the data-meisters that maintain the Global Shark Attack File!