Data cardinality is an important topic for for data analysis. In mathematical terms, cardinality is simply the number of elements in a set. But in data applications, cardinality signifies the number of unique values for a given field of data. Related terms include number of levels (thank you, PROC FREQ and NLEVELS), percent unique, as well as discrete data -- data with a finite number of different values. (That's not to be confused with discreet data, which is when you're careful not to share too much personal information. For example, we can count the Kardashians in discrete increments. But that doesn't mean that they behave discreetly.)
But first, this
Since I've been working with cardinality recently, I've developed this persistent earworm that I just can't shake. I decided to write it down and present it to you. (You're welcome.)
(I've got) Cardinality (Apologies to Lloyd Price)
>> Click here for suggested tune.
Oh-oh-over and over
I'll iterate through each row
Over and over, tell me why it's so
Over and over, each value that's unique
But oh-oh-over and over
I wish I ran my PROC FREQ
'Cause I've got - (cardinality)
High - (cardinality) N - (cardinality)
Discrete - (cardinality) HUGE - (cardinality)
Unique - (cardinality)
'Cause I got a big data set
So over ... and over
There's a high percent unique
Well, well, well over and over
I wish my data were discrete
Cardinal importance of cardinality
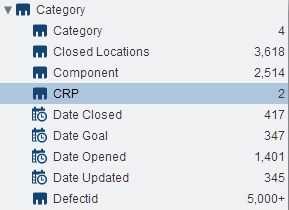
SAS Visual Analytics -- which I've been using for recent projects -- makes a big deal out of cardinality. The displayed list of variables shows the cardinality values front-and-center (see the inset screenshot image). Knowing how many different values a column can take on should influence the type of visualization you design. For example, it might make sense to group a set of charts by GENDER, which typically has a cardinality of 2 (or at most 3, if "unknown" is permitted). However, it would make less sense to group your charts by CUSTOMER_ID when that field has a cardinality in the thousands.
Many SAS users already know how to calculate cardinality. sasCommunity.org hosts a useful reference on "Cardinality Ratio" (more-or-less curated by Ron Fehd), complete with sample programs, SAS macros, and explanations.
I have a variation of my own, developed mostly by my colleague Hans-Joachim Edert. It produces a report like this:
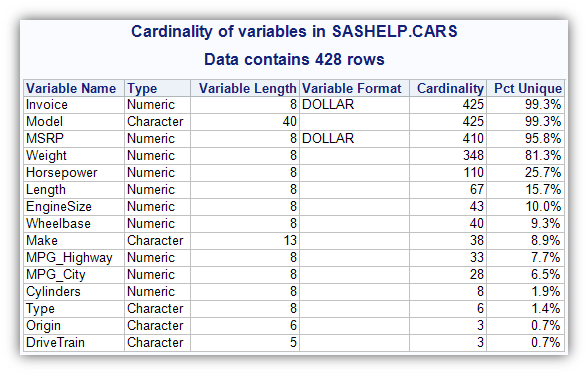
What can you learn from this report? In this example, we can see that Origin (where the model of car comes from) has just 3 possible values, making it less than 1% unique across the 428 records. That might make it a good grouping variable. Model, on the other hand, has a unique value for almost every record. The fact that it's so close to 100% unique might indicate a data quality problem. (Do we expect all Model names to be unique?) And the numeric variable Cylinders has only 8 different values, which might indicate that it's more of a category than a measure. (Would you want to SUM or AVERAGE the Cylinders across these records?)
Here's a link to the program code if you want to try it yourself. Here's a sample call to the macro in the program:
%getcardinality(SASHELP.CARS, WORK.CARDS, 1); |
Coming up...
In a future article I'll present a SAS Enterprise Guide custom task that makes the "check cardinality" process easy -- no programming. (Here's a sneak peak.) But you do not have to wait to learn more about your data: you can already glean much of this (and more) by using the Characterize Data task.

7 Comments
Cool! Thanks for sharing.
Pingback: How to store data about your data in your data - The SAS Dummy
Pingback: A custom task to check your data cardinality - The SAS Dummy
Thanks for the name-cheque, Chris.
In my fall paper on this topic for the regionals I show code to create a variable using nlevels and cardinality ratio to identify the 3 major categories of variables: unique, discrete, and continuous.
Check this page which will soon have a calculation of the mean of CR,
which can be used for later list processing.
http://www.sascommunity.org/wiki/Cardinality_Ratio
Ron Fehd macro maven
Hi Ron,
Thanks for bringing light to this important concept. Both Chris and I picked up on your work. See 'props' (page 6) :-)
http://minnsug.org/wrp/wp-content/uploads/2013/10/Beyond_NLEVELS_MinnSUG_20131017_CAJ_final.pdf
Great work Ron.
Carole
Hi Chris,
Great post, albeit I am late to the party. Someone from MinnSUG recently sent me a link to your post from 10/16/2013, they had attended my presentation on the same subject on 10/17/2013.
They saw your post and made the connection a year later!
Interesting that we were both investigating this topic at the same time. Here is a link to my presentation from 10/17/2013:
http://minnsug.org/wrp/wp-content/uploads/2013/10/Beyond_NLEVELS_MinnSUG_20131017_CAJ_final.pdf
The biggest issue I run into is when FREQ fails due to data size and field granularity. Additionally, I like to track %missing in such a report, so I add that into the mix. Yes, it's great to know that there are missing values (misslevels=1), but how sparse is the field exactly (percentmissing) ?
Best regards, and great post!
Carole Jesse
Here is my 2016 update on cardinality ratio and cardinality-type in (few,many,unique)
tags= code book, data dictionary, extended attributes