Sustainability is an idea whose time has come. Individuals, organizations and governments are increasingly recognizing that it doesn’t make sense to compromise the future to meet the needs of the present. To that end, the UN recently replaced the Millennium Development Goals (MDGs) with the Sustainable Development Goals (SDGs). It’s a good start.
In my last post, I discussed the idea that organizations aren’t keeping pace with technology, instead remaining mired in authoritative and competitive mindsets that breed inequality and do little to improve our future. I introduced our work towards a new business model that can instill sustainability and further general happiness, an idea that’s covered in my book, The Sustainable Organisation: a paradigm for a fairer society. Now I want to present the reasoning behind the sustainability metric put forth in that book, and how to use it.
As people, we can make the changes that the world needs to become sustainable, but we cannot make much of a dent on an individual basis. Change can only happen if people organize and work together, meaning that organizations are the pillars of sustainability. How can we measure progress?
First we need to assess these organizations and understand whether they are sustainable and in what areas. But existing organizational metrics are mostly flawed, because they don’t consider the impact that organizations have on people. To fill this gap, my co-author and I created the Sustainable Organization Index (SORG), an assessment tool that can enable anyone in any part of the world to understand and compare the real impact that any organization has—both in our lives, and in the lives of the generations to come.
It works by ranking organizations according to their impact in the society. By using publicly available data, the SORG measures the balance between the economic benefits of the organization’s owners, the employees (who we like to call the Team) and the community it serves. It is represented by the following formula:

Here, C is the economic benefit of the community as a result of the organization’s activity, while O is the economic benefit of the owners of the organization, M is the median salary, A the average salary and “E” is the highest, or the CEO, salary in the organization.
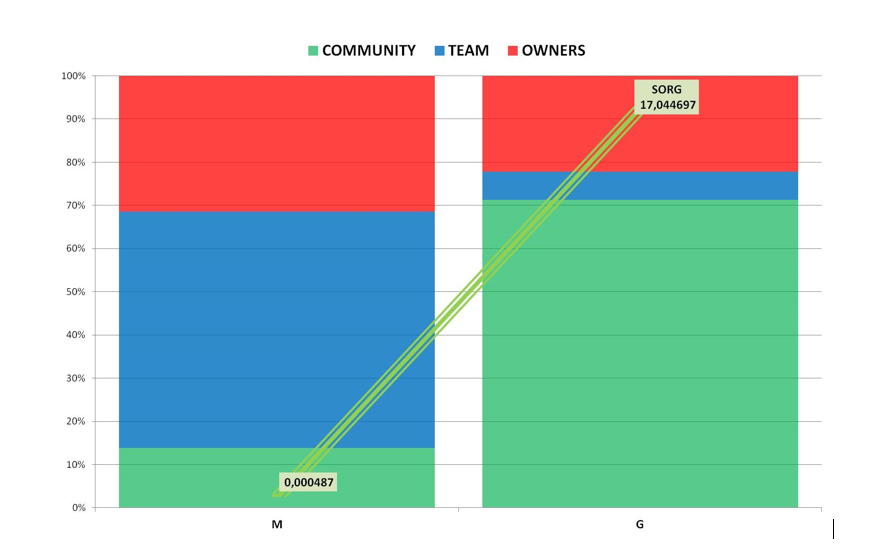
To illustrate the application of the Index, we’ll use the example of company G and Company M. When computing the SORG, we get a result of approximately 17.04 for G. Now, in a sustainable organization, the SORG has to be higher than 1, which means that G clearly shows a balance and highly benefits its community.
If we use this calculation with M, the result is entirely different, with a SORG of 0.00048. Here, we can see that G’s SORG is more than 36,000 times higher than M! (Although, if you compare their market capitalization value today, the ratio is only 4.8.) How can this be? In essence, these organizations have a completely different behavior when it comes to the benefits they provide to the community, their internal cohesion and the benefits the owners of the organization receive. This is where the SORG becomes interesting: if these results are compared with the market capitalization of these organizations, we can see how speculation affects metrics. And that’s the great thing about the SORG – it is completely immune to speculation, since it does not involve any market figures.
But why is this important? If we think of an organization as a group of people gathered around a common purpose and consider that this organization can only be sustainable if there is a balanced distribution of economic flow among the owners, the team and the community, then the direct value of the organization’s activity can be measured by its revenue and the positive/negative impact it may generate over time.
And if, in the words of Kofi Annan, “information is power” and “knowledge is liberating,” then the pure fact of access to such an assessment gives people the power to judge organizations. Given a clear image of how an organization behaves in the society and the extent to which it is driven by speculation, they can assess whether or not they are being treated fairly.
To facilitate the assessment, we have grouped organizations into three types. First, we have the “Prince John” organizations, in which the revenue directed to the owners by the organization is higher than that directed to the team and the community. We base the name on the sworn enemy of Robin Hood, who directed the crown’s gains to its representatives. Here, the SORG is always lower than 1.
Then, we have the “Robin Hood” organizations, which are precisely the opposite. Here, the organization directs most of its revenue to the community and the SORG is always greater than 1.
Finally, we have the “Brotherhoods,” which are organizations of people bonded by friendship, support and understanding. Here, the distribution of revenue widely favors the team rather than the community or the owners, and the SORG is always lower than 1. This simple classification could prove extremely useful if integrated into the rankings for top world organizations.
In my next and final post in this series, I’ll break down the index into its internal and external components to identify imbalances. In the meantime, please check out my book, The Sustainable Organisation: a paradigm for a fairer society, to learn what companies are included alongside SAS as leaders in the field of sustainability.


2 Comments
Quick question: why is average income dividing median income? I enjoyed reading. I may have to be more rich or more compassionate through knowledge to agree completely. I support sustainable development.
Thanks for your question. Its not income. Its salary. I will explain in detail in my next post.