A colleague and I were looking for a good example of how analysts used to use graphics to report data, a data visualization before and after, so to speak. We needed a good "before" screenshot for a “before and after” comparison for our SAS Global Forum 2015 paper, Visualizing Clinical Trial Data.
Mike Drutar and I often give presentations where we talk about the old days and how people used to visualize data. Of course, when we talk about how people used to do this, we are really talking about how we used to do it. I can remember coding JCL on a mainframe to run SAS, although even under a combination of phenobarbital and hypnosis, I doubt I could recall a line of that code. And Mike was implementing BI back when OLAP was the latest new thing.
So, what better to use for an example of the "before" screenshot than something we ourselves did in that paper we wrote 10 years ago? The only problem was that, when we went to retrieve the paper, we realized that it was not 10 years ago; it was only five. Five years. What seemed like ancient history to us was not even a decade old, hardly the stuff of analytic antiquity.
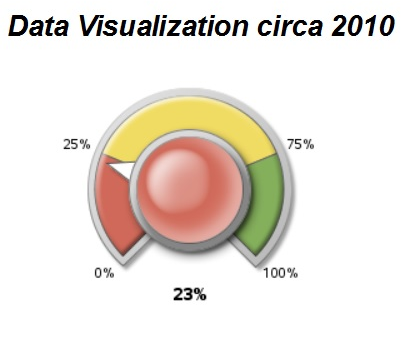
We found our example, a lovely static dial, circa 2010.
The code in that paper still works. But it is amazing how much things have changed in only five years.
Back in 2010, we were trying to speed up benchmark reporting by automating the generation of a static dial or slider. We would crunch big data (~2GB) at night and turn it into just a few rows of a SAS data set to ensure everything surfaced quickly on a web page. We thought users would love the ability to automate multiple benchmarks and surface a png graphic for each KPI. That still works.
But these days, no one is afraid of "big data." Five years ago, we were still trying to reduce the data to 10 rows. These days, we effortlessly load up 10 gigabytes.
In fact, several years ago when we first started prototyping on a LASR server, we generated a simulated data set that we thought was enormous (~5GB). When we told another colleage in R&D how easily LASR crunched that, he told us that 5GB was trivial. We needed bigger data. For about a week, every night, we ran another iteration of our simulation, blowing up the data from 5GB to 10GB to 15GB to 20GB. When our desktop machine chugged to a grinding halt, unable to generate a larger data set, we started building multiple data sets that we moved to LASR and merged within LASR, itself. No problem.
We quickly realized that the LASR server was like Muhammad Ali. You keep punching it with data for 8 rounds and it just stands there laughing at you. Then, you click on a report and SAS Visual Analytics comes off the ropes dancing like it just heard the first bell.
Suffice to say, it helps to adjust your analytic strategy accordingly.
But it is not just the power of newer technologies. The functionality is radically different too. Back in 2010, once those KPI graphs were on the web portal, all you could do was stare at them. Our KPIs might as well have been printed on paper. We did, in fact, explain how to write them out as a PDF.
These days, benchmarking is ad-hoc and interactive. Choose your sample on the fly and drag and drop whatever comparison you want. And instead of graphs being just static objects, the graphs themselves are interactive. There's no need to set up a conference call with the analytics team and scope out a 3-month data mining project. Just keep clicking on the report. All of the data you need is right there.
Back in 2010, data security was critically important and that has not changed. But there has been a change in how organizations feel about sharing their data. Whereas once we were working on projects that could not even be named, these days we are just as likely to be working on projects where the organization wants to be as open as possible.
For example, Project Data Sphere is a SAS-hosted project where pharmaceutical companies have joined together to share clinical trial data, making once-secret data readily available to researchers. Another example? SAS is hosting UN Comtrade data on a SAS Visual Analytics platform to make international trade data available to researchers.
We used to ask, "What else do we need to do to lock down this system?" These days more often we are asking, "What can we do to make it easier to access and use these data?" Efforts like Project Data Sphere and the UN reporting would be impossible without the power of cloud computing and big data technologies.
Of course, some things never change. Mike is still loading our simulated data to a temp directory called "Zeppelin" and I am still drafting reports using the same set of colored pencils I bought at a back-to-school sale for a dollar several years ago. When the rapid prototyping dev cycle lasts one week, you adopt some perhaps statistically anomalous work habits. Why break what still works?
But when we talk about the limitations of the old days and the old ways, Mike and I don't mean you. We mean us. And when we talk about what's new and what's next, we mean us. And we mean you, too.