When I talk to companies on how to improve their forecasting process they often share their difficulties with handling demand from potential large orders, where they are in a tender situation. Further, demand originating from tenders is increasing.

Tender demand have characteristics which makes it difficult to handle in traditional time-series forecasting.
1) It is large orders – often on a non-standard product variant.
2) The order is known in advance – but whether it turns into an order can be unknown until very late in the process.
Three issues regarding tender demand cause uncertainties that requires decision making based on insufficient information.
- Whether to include it in the forecast – and reserve capacity and purchase materials in order to fulfil the order.
- Delivery dates – and thus when capacity and materials are needed.
- Lead time – i.e. the time from order is placed to delivery starts. It may require initiating purchasing and production before order is firm.
Decisions regarding tender demand is traditionally solved by having the sales responsible assign a percentage showing the likelihood to close the deal – which is then used to make the decisions on how to include demand in forecasting and planning. Setting the percentage can be done in more or less sophisticated ways and may even be the result of internal collaboration, but it still ends up being a guess – and may be biased.
In this article, I will present an approach for dealing with tender demand in a structured way – using data as the key input. Data can remove uncertainty and allow for a more structured way of decision making.
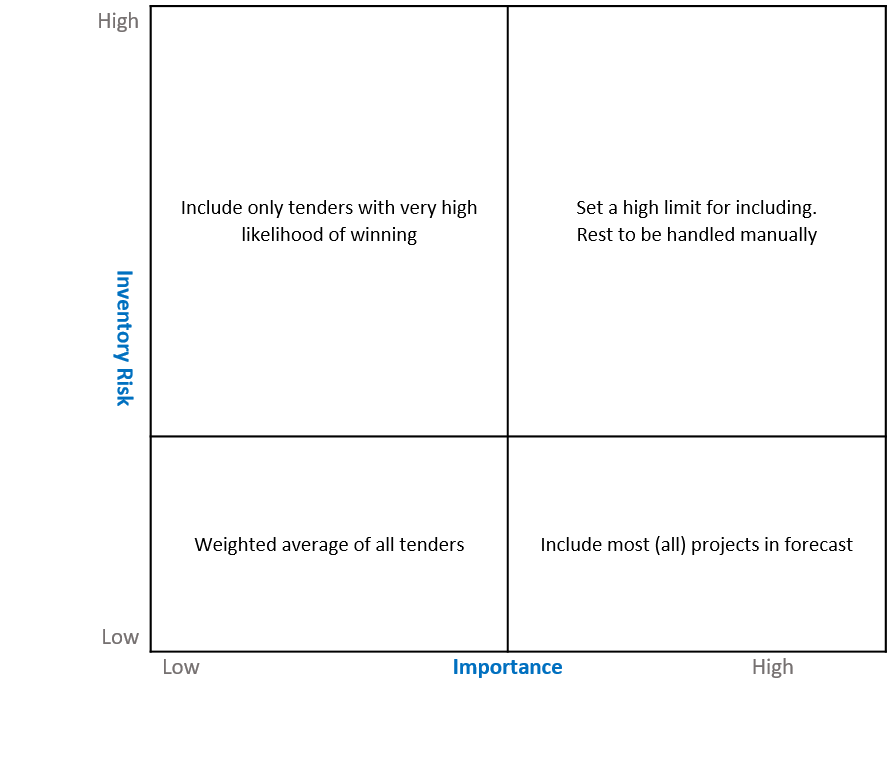
A classic matrix
The start is simply to differentiate how tender demand orders are reviewed.
As a start – make an operations risk assessment – what will happen to the inventory / capacity if the order is included in forecast but not realized. Basic questions that can be calculated using data already available.
- Percentage of special components compared to order value
- Additional components needed compared to normal demand.
Secondly – review the tender from a strategic point of view. That is how important is landing this order to the company.
- How important is the customer
- How big is the order value
This leaves us with a classic 2x2 matrix, which is great for visualizing how different cases should be handled.
Data
Data, which may support the decision-making, are typically available in the ERP and CRM system.
The risk part is highly dependent on the product offered, which means that a BOM breakdown combined with a comparison to normal component consumption and inventory will reveal how big a risk this particular order poses. Likewise, data determining the importance of winning the order, i.e. order size and customer importance, can often be located in the ERP or CRM systems. In case of new customers it may however be relevant to look outside the company to find.
In its essence, demand from each corner should be treated differently – and the limit for including the demand in the forecast differs for each corner. But instead of using the manually set value – use predictive Analytics to determine the likelihood of winning the order.
Use predictive analytics to forecast likelihood to win the order
Predictive Analytics deal with the future. It rests on the assumption that historical and current observations can be used to make predictions about future events; that patterns in explanatory variables can predict the likely outcome for the dependent variable. The answer from Predictive Analytics is either:
- What are the chances of an event occurring at a future point in time?
- Should an event occur, what is the impact or amount involved?
This means that by looking at characteristics from past tenders, using the win/lose as the dependent variable, it may be possible to identify patterns in data that enables a better prediction of whether this tender will be won or lost.
The data are both the static data concerning customer, materials, price etc. – but should also include some of the dynamic data – i.e. the development on each order – e.g. if the order lies still for x days – it is not likely to become an order – or the development of the likelihood to close figure.
Do not rule out the manually set percentage figure yet
The outcome from the predictive analytics should go alongside the manually set figure. The reason for not eliminating the manually set figure – which is tempting if you have a data based calculation of the same figure – is the fact that not all relevant data may be stored in the system – e.g. information gathered in talks between sales person and customer.
It will however put focus on the manually set percentage – which is likely to become less biased, and it will allow for systematic follow up on, how these are determined.
Further – the manually set percentage figure is a potential variable in the analysis.

1 Comment
Really good article , truely appreciated your work
keep up the good work and keep inspiring us...