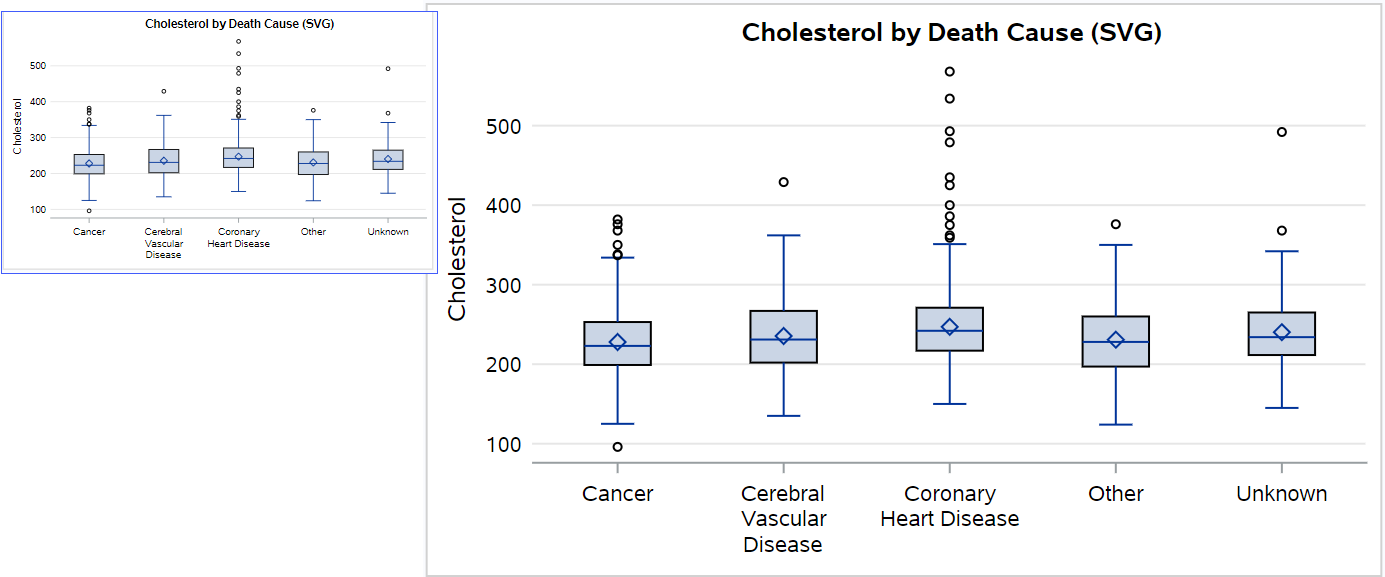
Note: The default graphics output format for the ODS HTML5 destination is Scalable Vector Graphics (SVG). SVG documents display clearly at any size in any viewer or browser that supports SVG. So, SVG files are ideal for display on a computer monitor, PDA, or cell phone; or printed documents. Because it's a vector graphic, a single SVG document can be transformed to any screen resolution without compromising the clarity of the document. Here's an example:

SAS/GRAPH procedures
When you use the ODS HTML5 destination with a SAS/GRAPH procedure, specify a value of SVG, PNG, or JPEG for the DEVICE option in the GOPTIONS statement. The following sample PROC GPLOT code embeds SVG graphics inside the resulting HTML output:
goptions device=svg;
ods _all_ close;
ods html5 path="c:\temp" file="svg_graph.html";
symbol1 i=none v=squarefilled;
proc gplot data=sashelp.cars;
  plot mpg_city * horsepower;
  where make="Honda";
run;
quit;
ods html5 close;
ods preferences;
Note that the ODS PREFERENCES statement above resets the ODS environment back to its default settings when you use the SAS windowing environment.
When you use the PNG or JPEG device driver with the ODS HTML5 destination, add the BITMAP_MODE="INLINE" option to the ODS HTML5 statement. Here is an example:
goptions device=png;
ods _all_ close;
ods html5 path="c:\temp" file="png_graph.html"     options(bitmap_mode="inline");
symbol1 i=none v=squarefilled;
proc gplot data=sashelp.cars;
  plot mpg_city * horsepower;
  where make="Honda";
run;
quit;
ods html5 close;
ods preferences;
ODS Graphics and SG procedures
When you use SG procedures and ODS Graphics, specify a value of SVG, PNG, or JPEG for the OUTPUTFMT option in the ODS GRAPHICS statement. The following sample code uses PROC SGPLOT to embed SVG graphics inside the HTML output with the ODS HTML5 destination:
ods _all_ close;
ods html5 path="c:\temp" file="svg_graph.html";
ods graphics on / reset=all outputfmt=svg;
proc sgplot data=sashelp.cars;
  scatter y=mpg_city x=horsepower / markerattrs=(size=9PT symbol=squarefilled);
  where make="Honda";
run;
ods html5 close;
ods preferences;
The following sample code uses PROC SGPLOT to embed PNG graphics inside the HTML output with the ODS HTML5 destination:
ods _all_ close;
ods html5 path="c:\temp" file="png_graph.html" options(bitmap_mode="inline");
      ods graphics on / reset=all outputfmt=png;
proc sgplot data=sashelp.cars;
  scatter y=mpg_city x=horsepower / markerattrs=(size=9PT symbol=squarefilled);
  where make="Honda";
run;
      ods html5 close;
      ods preferences;
The technique above also works when you use the ODS GRAPHICS ON statement with other procedures that produce graphics output (such as the LIFETEST procedure).
Note that the ODS HTML5 destination supports the SAS Graphics Accelerator. The SAS Graphics Accelerator enables users with visual impairments or blindness to create, explore, and share data visualizations. It supports alternative presentations of data visualizations that include enhanced visual rendering, text descriptions, tabular data, and interactive sonification. Sonification uses non-speech audio to convey important information about the graph.
You can use the ODS HTML5 destination in most situations where you need to embed all of your output into a single HTML output location. For example, when you email HTML output as an attachment or when you create graphics output via a SAS stored process. If you currently use the ODS HTML destination, you might want to experiment with the ODS HTML5 destination to see whether it meets your needs even if you cannot completely switch to it yet.

1 Comment
HTML 5 does not allow frames. How does SAS manage the contents links for multiple pages?
SVG can include CSS styles. SAS outputs explicit style attributes for every element. I asked SAS Support if CSS styles could be supported in SVG. The answer is "no", CSS styles are not supported at all for any graphics style elements.
Maybe future versions of SAS will implement standards more completely?