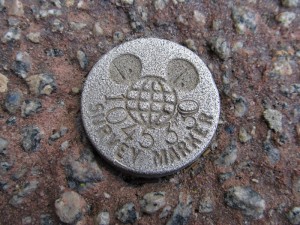
Usually when you hear the expression "That's gonna leave a mark!", it's a bad thing!
... But, in this case, it's actually good!
Since many of you SAS Global Forum attendees and/or your family members might be visiting the Disney park, I thought it would be fun to use SAS/GRAPH® to help create something to add to the adventure and excitement.
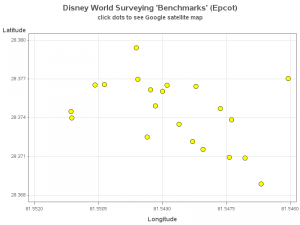
In this case, I've created a "drill down" graph and table to help you discover the "Disney Surveying Benchmarks."
These surveying benchmarks are metal markers that were used to help line up the surveying gear. There are a handful of them scattered around the park, and if you know where to look, it can be fun to try to find them while you're there. And if you're really a techno geek (what?!? - techno geek SAS users? say it isn't so! Hahaha!) you could even plug in the coordinates from the SAS table, and let your GPS guide you straight to them!
Without further delay, here's a link to the interactive SAS graph and table
You can click on the markers in the graph to see a Google map zoomed in to the marker location. And you can click on the link in the table to see a page describing that marker.

