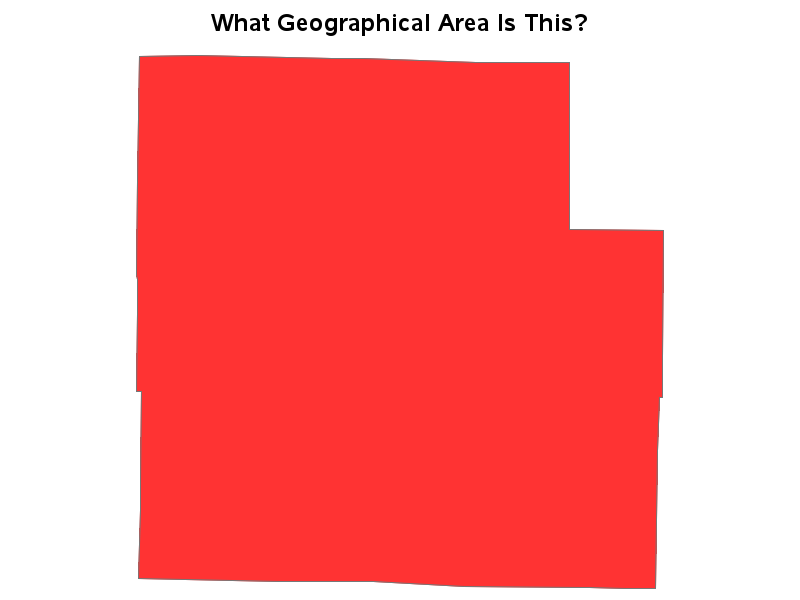
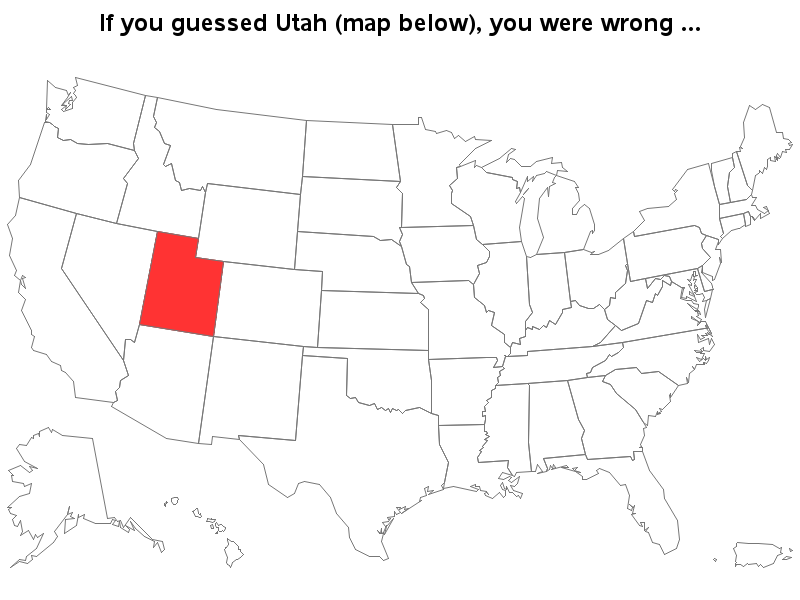
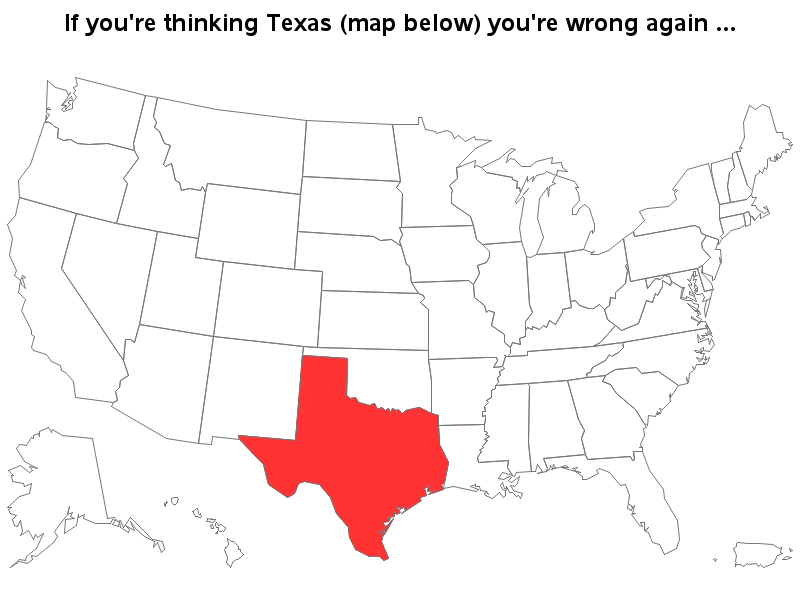
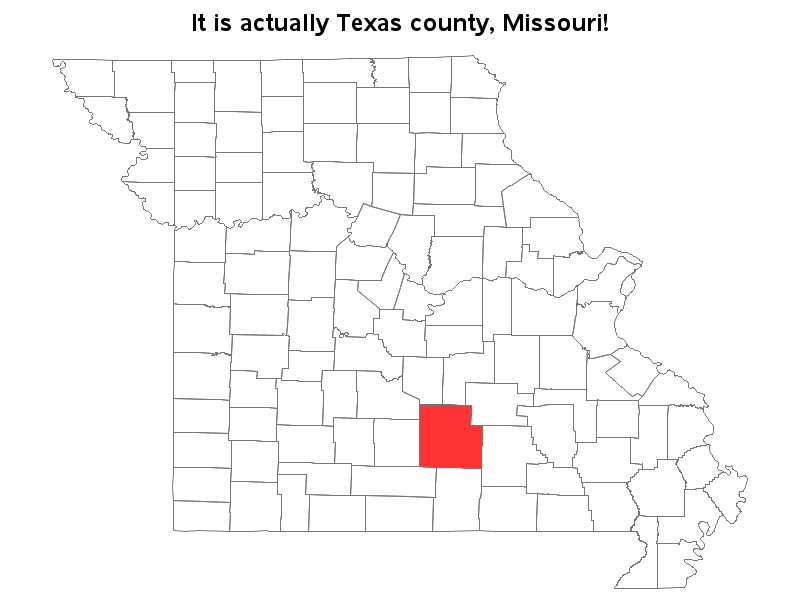
My blog posts focus on visual data analysis, and many of them use geographical maps. Therefore I hope you will have fun with a quick geography quiz, which I created using SAS/Graph ...
And what, you might ask, is the purpose of this little exercise?... Well, aside from having a little fun, I hope it warns you of the dangers of jumping to conclusions based on your initial visual perception of data. Also, be sure to plot your data in context, to help lead your readers to the correct conclusions!
Now, see how many of your friends can pass this quiz! :)


3 Comments
Nice example.
Fun. It didn't quite look like Utah. The missing rectangle is 4x2 instead of Utah's 3x5.
Sharp eye!