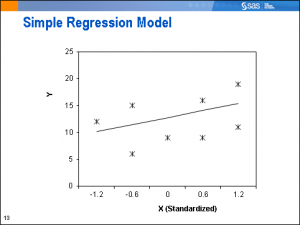
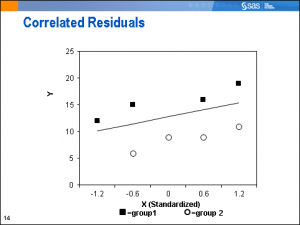
Let's assume that these observations come from two clusters (groups) in our population. When we account for the clusters, the graph looks like this:
Now we can see that the observations are not independent, as we assumed. They are correlated, with all the observations from group 1 above the estimated regression line, and all the observations from group 2 below the estimated regression line.
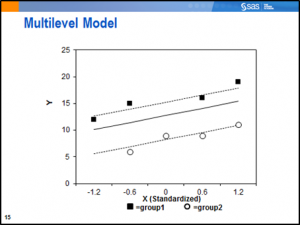
A multilevel model would account for the correlations among the observations within each group and allow for separate lines to be estimated:
For this overly simple model with two groups, an ANCOVA model would be satisfactory. However, for a large number of groups (such as patients nested within hundreds of clinics, or perhaps customers nested within thousands of banking centers), a multilevel model is a parsimonious way to handle a large number of groups. As a bonus, if the groups can be envisioned as representing a larger population of such groups, the model can be generalized to the population. This means that even if only a sample of the clinics or banking centers is in your study, you can generalize your results to obtain estimated lines for all the groups in your population, including those that are not a part of your study.
Multilevel models can be fit in PROC MIXED (for continuous outcomes) or PROC GLIMMIX (for continuous or discrete outcomes). The code below would fit the model illustrated above for a continuous outcome:
proc mixed data=data-set-name; model Y = X-standardized / solution ddfm=bw; random intercept X-standardized / subject=group_id type=un; title 'Multilevel Model'; run; |
Even though the lines seem parallel in the plot above, the model fit by this could code would allow for the estimation of separate slopes for each group.
For more on multilevel models, check out Part 1: Do I need a multilevel model?
We have courses available throughout the year and in June at our Analytics 2013 conference in London.


