Now the summer has begun, Olympic fever is starting to rise in many countries. In the meantime I took a look at www.databaseolympics.com to the results of last summer Olympic Games in 2008 in Beijing. I wondered if it would be possible to discover patterns in those data when they were combined with economic indicators such as the gross domestic product (GDP) and the population of the respective countries in that same year found on data.worldbank.org.
What is clustering?
Clustering is a multivariate technique of grouping rows together that share similar values. The goal of clustering is to partition data into groups so that the observations within a group are as similar as possible to each other, and as dissimilar as possible to the observations in other groups.
There are several clustering methods; the most common ones are k-means clustering and hierarchical clustering. I choose for hierarchical clustering as this is a good method for smaller data sets. At each step, the two clusters that are closest together are combined into a single cluster. This process continues until there is only one cluster containing all the points.
Clustering is possible in many SAS products: SAS Enterprise Guide, SAS Enterprise Miner, Base SAS, JMP. I performed the Olympic cluster analysis in JMP.
How to cluster in JMP?
- Open the medals dataset in JMP and select Analyze > Multivariate Methods > Cluster
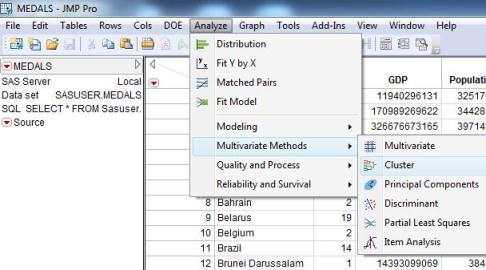
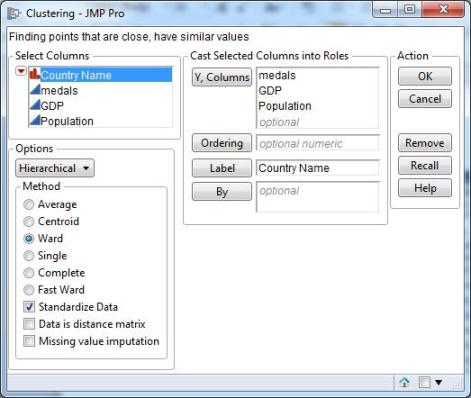
- Select medals, GDP, population -> Y, Columns
- Select Country Name -> Label
- Make sure that Hierarchical is selected under Options and that Ward and Standardize Data are checked under Method.
- When you click OK, the clustering process proceeds.
How to interpret the results?
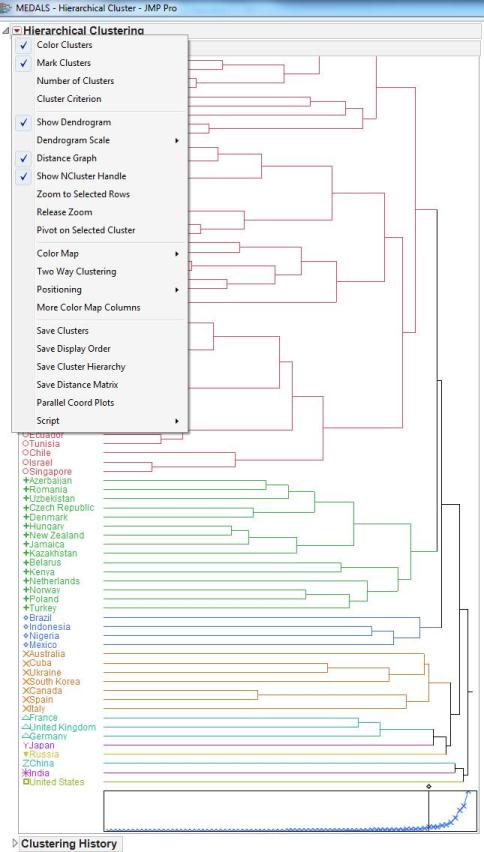
The clustering sequence is easily visualized with the help of the dendrogram. A dendrogram is a tree diagram that lists each observation, and shows which cluster it is and when it entered its cluster.
You can drag the small diamond-shaped handle at either the top or bottom of the dendrogram to identify a given number of clusters. I wanted to identify 10 clusters. If you click on any cluster stem, all the members of the cluster highlight in the dendrogram and in the data table.
The scree plot beneath the dendrogram has a point for each cluster join.
In the clustering history table you see that the number of clusters begin with 83, which is the number of rows in the data table minus one. You can see that the two closest points, Estonia and Trinidad & Tobago, are joined to reduce the number of clusters to 82. At the very end a cluster led by Afghanistan is joined by the rest of the points, led by China. The order of the clusters at each join is unimportant, essentially an accident of the way the data was sorted.
How to identify the clusters?
When you want do describe the obtained clusters, things get a lot easier if you color and mark the clusters (click on the red triangle next to Hierarchical Clustering and check the first two options).
In the same popup menu you can also save the cluster number as a new column in your dataset (select save clusters). Now you can create a data set based on the sorted cluster number:
- Select Tables > Sort
- Select Cluster -> By and click on the descending sort button
- Type Olympic clusters in the output table name field
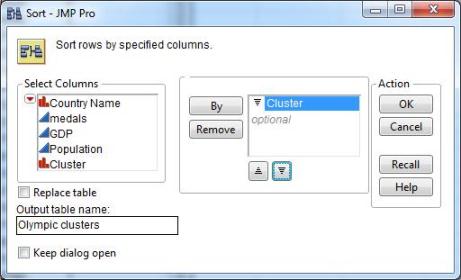
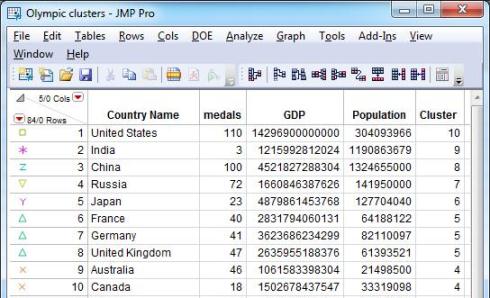
This will be your result. Notice that the rows are marked the same way as in the dendrogram.
What are the clusters telling us?
Each of the first five clusters only contains one country, that is because their values in the variables medals, GDP and population vary strongly. The United States has the highest number of medals, together with the largest GDP. China on the other hand obtained a similar number of medals as the US, but has a significantly different GDP and population and is therefore in another cluster. Russia is number three in the medal ranking, but is ranked 8th and 7th on GDP and population. India, who has the second largest population only obtained 3 medals at the Olympics in 2008. Japan, with the second largest GDP is ranked 11th when it comes to Olympic medals.
France, Germany and the United Kingdom form a cluster together, as they share a similar number of medals, GDP and population. Remarkably this is the only cluster with countries in the same region.
Australia, Canada, Cuba, Italy, Korea, Spain and Ukraine share a similar population size and they have all obtained quite a number of Olympic medals.
Brazil, Indonesia, Mexico and Nigeria are in the top 10 when it comes to population, but we find them rather low on the medal ranking.
Azerbaijan, Belarus, Czech Republic, Denmark, Hungary, Jamaica, Kazakhstan, Kenya, Netherlands, New Zealand, Norway, Poland, Romania, Turkey and Uzbekistan performed very well on last Olympics despite their smaller population and/or GDP.
The last cluster groups all countries who obtained few medals in 2008.
I wonder if I will find the same clusters after this year’s Olympics. Let’s find out in a few weeks!
Want to learn more about clustering?
Consider one of these SAS training courses: Applied Analytics using SAS Enterprise Miner, Applied Clustering Techniques.

4 Comments
this was really good, simple and easy to understand. really helped in my assignment. god bless u richly! :)
I really enjoyed this demo of the clustering platform.
Typo:
Bolded word should be changed to two
Thanks for the feedback. The type has been fixed.