Today, I needed to figure out how to create a simple measure for OLAP and have it available to the users. Fortunately, EG has a great Create New Measure GUI for this! It creates the MDX code on the fly! Okay, bear with me. There are several steps to this, but then you don't have to write MDX code or worry with creating the data point elsewhere. The example is to create a percent of total (otherwise know as a relative contribution) for the amount displayed in the cell.
1. In SAS Enterprise Guide, with the OLAP Cube Viewer, create a New Measure. On the second step select 'Relative Contribution Analysis'

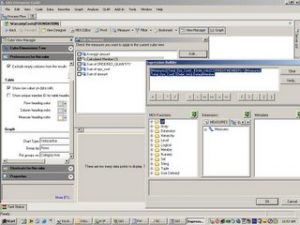
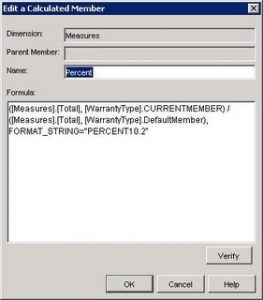
2. Now go back (still in EG) and grab the MDX code to save permanently in the OLAP Cube! Click Measure, Click the new measure (make sure the box is checked), Click edit, and you'll end up with the image below. Copy & paste the text - like I did.

3. Finally, with this snippet of MDX code, lets go to the OLAP CUBE STUDIO. Click the 'Calculated Members' button on the left icon bar. Select the Cube you're looking to edit & then create a new measure. Paste that EG created MDX Code into this and save it. Now all of your users can see this same calculated measure!


2 Comments
Hi Tim,The problem is that a calculated measure is just that, calculated. It needs a backbone to stand on. Having it as the sole measurement is tricky - but I will add a possible solution below.The other option is to provide your users with a 'default' view that only shows the "Percent of Total" value in the cube - any resulting graphs would have that as the only measure. You could accomplish by modifying the SASGeneratedMap (as mentioned in the post on 2/17/06). I haven't attempted this yet - but I'd start there.Essentially you could create a summarized table that only contains the calculated percent and the variables for your dimensions. Then by displaying the 'Sum of Percent' measure, your numbers might be accurate. This is readily dependant on your n-way. It would have to be a one-way frequency.
Hi Angela, Is there a way to create a calculated measure for Percent of Total across all dimensions? Something to mimic what the "Percent of Total" wizard in the VDE does, but having it resident on the cube? What I want is to be able to have the "Percent of Total" measure as the only measure in the OLAP table, with out it's corresponding measure, so my users can graph this with the "Percent of Total" being the only measure on the graph.