Get the right information, with visual impact, to the people who need it
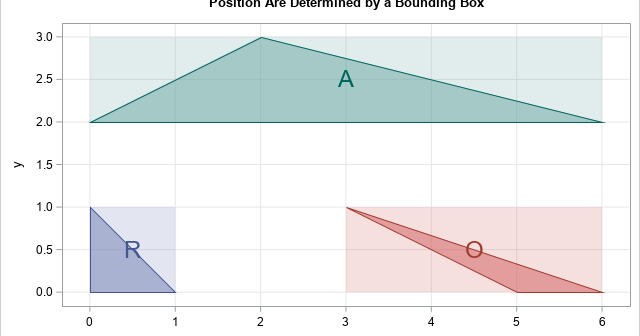
Labeling objects in graphs can be difficult. SAS has a long history of providing support for labeling markers in scatter plots and for labeling regions on a map. This article discusses how the SGPLOT procedure decides where to put a label for a polygon. It discusses the advantages and disadvantages

