Get the right information, with visual impact, to the people who need it
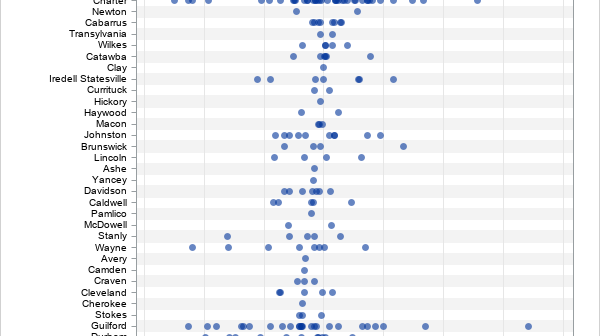
Standardized tests like the SAT and ACT can cause stress for both high school students and their parents, but according to a Wall Street Journal article, the SAT and ACT "provide an invaluable measure of how students are likely to perform in college and beyond." Naturally, students wonder how their

