In a previous article, I presented some of the most popular blog posts from The DO Loop in 2025. In general, popular articles deal with elementary topics that have broad appeal. However, I also write technical articles about advanced topics, which typically do not make it onto a Top 10 list. This post is an "Author's Choice" list of some articles that I want to highlight from 2025. Some are useful. Some are surprising. Some are straightforward, whereas others are challenging to read.
The following articles deserve a second look. I have grouped them into three categories: SAS-related programming, probability and statistics, and numerical computations.
SAS and statistical programming
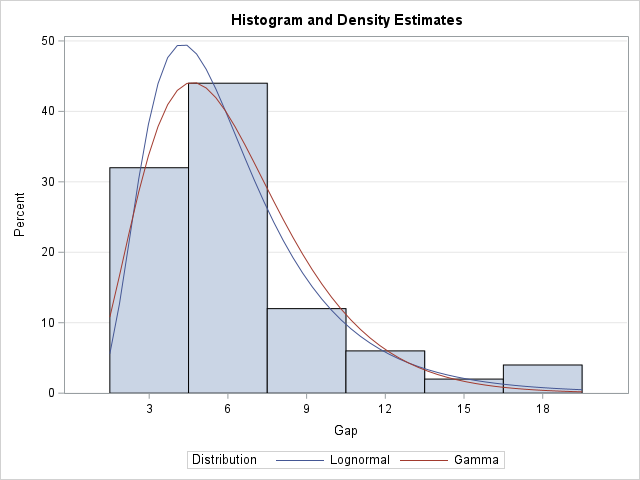
- Use a high-low plot to emulate a histogram in SAS: For years, I have been using the SAS Graph Template Language (GTL) when I want to overlay a custom density estimate curve on a histogram. But a faithful reader reminded me that you can use a high-low plot to emulate a histogram. If you do this, then it is easy to overlay custom density curves.
- A SAS macro technique for running a one-time task: Sometimes you need to run SAS statements only once. The canonical example is code that defines a library of functions in PROC FCMP or PROC IML. For code that you want to execute only one time, you can wrap the code by using "one-time macro."
- Implement a SMOTE simulation algorithm in SAS: This article shows how to implement the SMOTE algorithm for generating synthetic data from scratch by using the SAS IML language. The Visual Data Mining and Machine Learning (VDMML) license in SAS Viya supports the smote action set, which contains the smoteSample action. However, I always say that the best way to truly understand an algorithm is to implement it yourself, and this article shows the power of the SAS IML language for implementing modern algorithms in statistics and machine learning.
- Generate a check digit and validate a Universal Loan Identifier in SAS: Have you ever mistyped your credit card into a web site and been told that the credit card number is invalid? When a long number is used to identify a financial account, it is common to embed a check digit into the number, which can help ensure that the number is typed and transmitted correctly. This article shows how financial institutions use check digits. It also uses a very cool technique that enables you to compute the modulo operation for arbitrarily large integers in SAS.
Probability and statistics
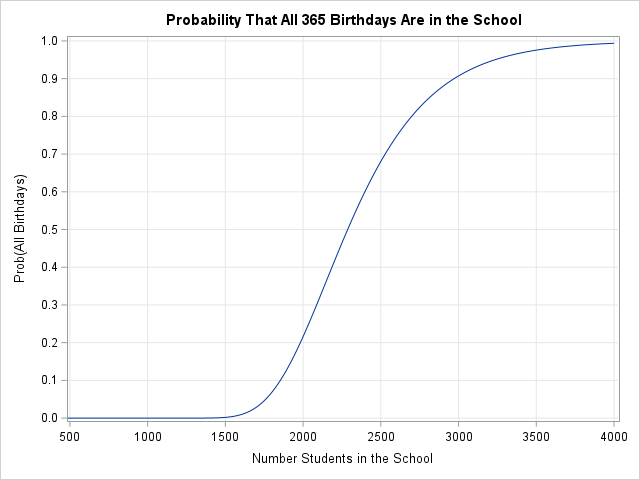
- Birthdays and the coupon collector's problem: If there are 1,000 people in an auditorium, what is the probability that all 365 birthdays (01JAN-31DEC) are represented in the room? You might assume the probability is high, but in fact it is less than 0.01%. This article writes a SAS program that can generate the probability for situations like this.
- Latin hypercube sampling in SAS: When a process has many categorical parameters, one experimental design is the Latin Square design, which you can generate in SAS by using PROC PLAN. In a similar way, when a process has many continuous parameters, you can discretize them into intervals and select random values from those intervals by using a Latin Square design. This article demonstrates how to carry out that process by using the SAS IML Language.
- Deviance residuals and the DEVIANCE function in SAS: In generalized linear models, the residuals of the models are often reported as "deviance residuals." What are deviance residuals? How can you understand the complicated formulas for the deviance formulas for distributions such as normal, gamma, and binomial?
- Visualize an ordinal response regression model: This article shows how to visualize an ordinal regression model such as the cumulative logit model in PROC LOGISTIC. It also discusses how to interpret the graphs.
Numerical analysis and matrix computations
The following articles are hard and technical. These are not for the faint-of-heart! But they reveal some interesting ideas that are useful in computational statistics, numerical analysis, and matrix computations.
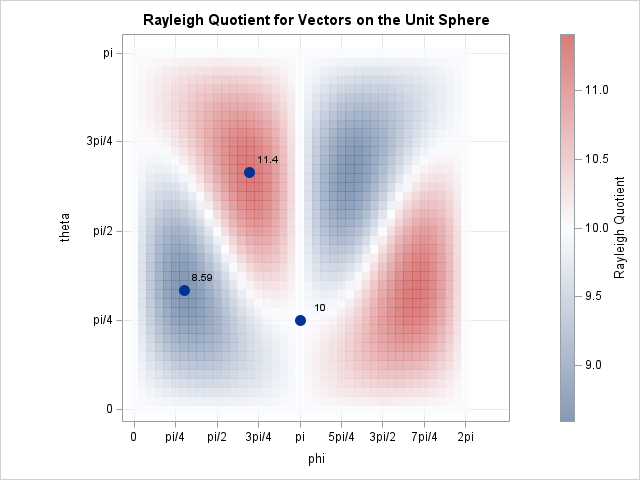
- Visualize Rayleigh quotients and eigenvectors: The Rayleigh quotient is a tool in linear algebra that is associated with eigenvalues and eigenvectors of symmetric matrices. You can visualize the Rayleigh quotient for 2x2 and 3x3 matrices by evaluating it on the unit sphere. The visualization reveals two important theoretical properties of the Rayleigh quotient: The maximum value is the largest eigenvalue, and the minimum value is the smallest eigenvalue.
- Use the Lambert W function to solve equations that involve exponential functions: Certain equations in statistics and applied math involve exponential functions. In the simplest cases, you can use the LOG function to obtain an explicit solution. In more complicated equations, you can use a lesser-known function, called the Lambert W function, to solve the equations.
- Matrix norms and spectra: It turns out that two symmetric matrices that have the same spectrum also have the same L2 and Frobenius norm. This is result helps you to visualize correlation matrices that have the same eigenvalues.
- Quasi-Monte Carlo integration in SAS: Monte Carlo and quasi-Monte Carlo integration enables you to numerically estimate the definite integral of a function over an arbitrary high-dimensional region. However, if you use the quasi-Monte Carlo method, the estimate of the integral converges much faster than for traditional Monte Carlo integration. This article shows how to generate quasi-Monte Carlo points in arbitrary dimensions.
Your turn
Did I omit one of your favorite blog posts from The DO Loop from last year? Maybe you liked my Pi Day post about ππ, which is "pi raised to the power of pi." Or maybe you enjoyed reading about the CYCLEATTRS option in PROC SGPLOT? Leave a comment and tell me what you liked (or disliked!) about The DO Loop blog in 2025.
