The new school year had barely started when I got a call from a friend who is an elementary school principal. She told me that every morning she announces the names of students who are celebrating a birthday. "One student noticed that we've already had two days on which no student has a birthday," she said. "With 900 students in the school, she thought that at least one birthday should be announced every day. She wants to know more about the math for this situation."
What a great question! The student deserves a gold star for being curious about math. After making some calculations and running a simulation, I was able to confirm what the student had already observed: with 365 possible birthdays, a school that has 900 students will almost certainly have days during the school year on which no one is celebrating a birthday.
I'll call this problem the "school-birthday problem." In this article, I discuss why the school-birthday problem is equivalent to a classic problem in probability called the coupon collector's problem. I show how to express the solution to the coupon collector's problem in terms of Stirling numbers. I include a SAS program that calculates the probabilities in the coupon collector's problem.
Summary for students and teachers
The math for the school-birthday problem is more advanced than is usually taught in middle school, so let me first present the main results and save the details for subsequent sections.
Question: "If there are n students in your school, what is the probability that all 365 birthdays are represented by someone at your school?" The answer depends on n, the size of your school. In the following table, the left column contains a school size. The right column shows the probability that a school of that size contains all birthdays. You can convert a probability to "percent chance" by multiplying by 100. For example, a probability of 0.5127 means there is 51.27% chance.
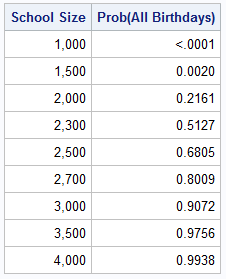
This table shows the following facts:
- A school that has 1,500 students or less has almost no chance of celebrating a birthday on every day of the year. The chance is less than 1%.
- A school that has 2,300 students has a 50% chance of celebrating a birthday every day of the year.
- A school needs 2,700 students before there is an 80% chance of celebrating a birthday every day,
Do these results surprise you? They should! Most of us would guess that 1,000 students would be enough to represent every birthday. But it's not.
These results imply something else: the probability that two students share a common birthday (month and day) is very high! There is a famous math problem (called "the birthday problem") that proves that "duplicate" birthdays are extremely common. In a classroom that has 23 students, the chance is 50% that two students share a birthday. If there are 30 students in your classroom, the chance is 71% that two people in the class share a birthday!
The coupon collector's problem
When I was a kid, cereal boxes often came with "prizes." These were often cheap toys or trading cards. To get you purchase more, the manufacturers would often offer six or more different toys or cards and advertise that you should strive to "collect the whole set!"
These childhood memories are examples of the coupon collector's problem, which is a classic problem in probability theory. The problem assumes that there are k distinct items that you are trying to collect. The items are traditionally called "coupons," but they are often trading cards or toys. To get a new item, you must draw uniformly at random from among the k items. A draw might result in a new item for your collection, or you might get a duplicate of an item you already have. The coupon collector's problem asks for the probability that you have collected all k items after n random draws. The coupon collector's problem is famous because the probability of collecting all items is much lower than most people think. I recall eating many boxes of Lucky Charms while unsuccessfully trying to collect an entire set of prizes!
The math for the coupon collector's problem is not simple, but the probabilities can be expressed in terms of
Stirling numbers of the second kind. The Stirling number
S(n,k) counts the number of ways that n random draws can be arranged among k distinct categories when each category must appear at least once.
This article shows how to use SAS to compute
the probability of having observed all k items after n draws, denoted P(X≤n).
According to the Wikipedia article about the coupon collector's problem, the probability is given by the formula
P(X ≤ n) = k! S(n,k) / kn
Because the numbers in this formula can be huge, a naive double-precision implementation on the computer can overflow. However, you can use a few
techniques in numerical analysis to obtain a more robust and numerically stable solution to the coupon collector's problem.
The coupon collector's problem for dice
To get started, let's forget about cereal boxes and birthdays for a moment. The coupon collector's problem is equivalent to rolling a die that has k equally likely faces. Each time you roll the die, you get a random number from the set {1, 2, 3, ..., k}. What is the probability that you have seen all numbers after n rolls?
Let's solve this problem for k=6, which represents a fair six-sided die.
The probability that you have seen all six faces after n rolls is given by the formula
P(X ≤ n) = 6! S(n,6) / 6n
The following SAS IML program defines
a function that computes a matrix of
Stirling numbers of the second kind. The numbers S(n,6) are in the 6th column of the matrix. You can extract the column into a vector
and multiply the Stirling numbers by 6! / 6n, where n enumerates the rows of the vector.
proc iml; /* Compute an (n x n) matrix of Stirling numbers. See https://blogs.sas.com/content/iml/2025/09/15/stirling-numbers-sas.html */ start StirlingMat(n); Sn = 1; /* first row: S1 = 1 */ S = j(n,n,0); S[1,1] = Sn; do i = 2 to n; j = 1:(i-1); /* pad with 0 to make rows the same size; overwrite S(n,.) with S(n+1,.) */ Sn = (j#Sn || 0 ) + ( 0 || Sn); S[i,1:ncol(Sn)] = Sn; end; return S; finish; /* The fast way to get the probabilities: Get a large matrix of Stirling numbers and extract the 6th column */ k = 6; /* number of faces */ m = 25; /* maximum number of rolls to consider */ n = T(1:m); S = StirlingMat(m); P6 = fact(k) * S[,k] / k##n; /* P(All faces appeared by the n_th roll) */ title "Probability That All Faces Appeared"; title2 "k = 6 faces"; xlabl = "n (Number of Random Draws)"; call series(n, P6) grid={x y} label=xlabl other="yaxis grid min=0 max=1 label='Prob(All Faces Appeared)';"; /* print P(X<=n) for n=6..15 */ print (P6[6:15])[L="P(All 6 Faces Appeared)" r=(6:15) F=6.4]; |
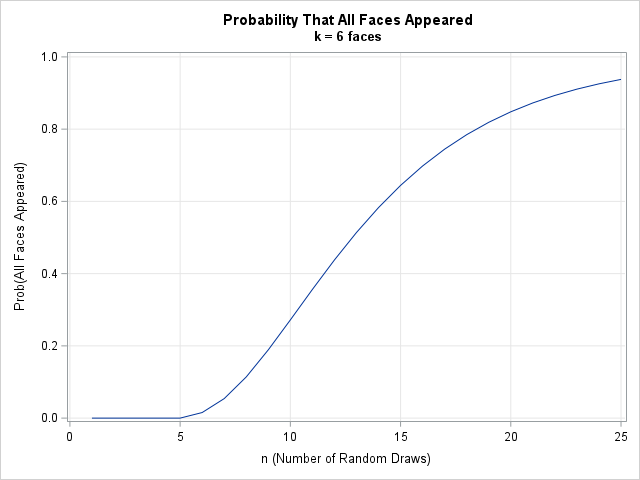
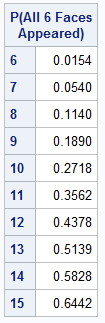
The graph shows the probability that you will observe all six faces of the die by the n_th roll for n=1, 2, ..., 25. The probability increases as you continue to roll the die. For 10 rolls, there is a 27% chance of having observed all six faces. For 13 rolls, the probability tops 50%. At 20 rolls, the probability is about 85%. Some probabilities are shown below:
This calculation shows that it might take longer than you expect to "collect" all six faces of the die. Rolling a six-side die until you've seen all faces is equivalent to eating boxes of cereal until you've collected all six trading cards. But rolling a die is faster, cheaper, and doesn't cause stomachaches.
Dice with more faces
You can buy dice that have 10 or 20 faces. If there are more faces (or more prizes to collect), it will take much longer to "collect" them all. For a 20-sided die, you must roll the die 50 times just to get a 20% chance of seeing all faces. You need 67 rolls to get a 50% chance.
As mentioned earlier, the "school birthday problem" is equivalent to rolling a hypothetical die that has 365 equally likely faces. A 50% chance of seeing every face requires about 2,300 rolls. An 80% chance requires about 2,700 rolls.
Dealing with large numbers in the coupon collector's problem
Computing these probabilities is not easy.
Recall that if you have k distinct items that you want to collect, and you draw each item uniformly at random,
the probability that you have collected the entire set after n draws is
P(X ≤ n) = k! S(n,k) / kn
where X represents the event "collected all k items".
The numbers in this formula are huge when k (the number of items) is large.
For example, the StirlingMat function in the previous section can compute Stirling numbers only up to n=219.
If n=220 or larger, the Stirling numbers "overflow," which means that they exceed the largest
number that can be represented in double-precision calculations.
Fortunately, you can rewrite the function to compute the probabilities directly by using two tricks, which are shown in the Appendix:
- The Stirling numbers satisfy a recurrence relation, which is used in the function to compute the matrix of Stirling numbers. The corresponding probabilities for the coupon collector's problem also satisfy a recurrence relation.
- The probability is written in terms of a ratio. You can use the exp-log trick to compute the ratio accurately, even when the numbers are large.
The following SAS IML program uses these tricks to evaluate the vector of probabilities P(n,k) for n=1,2,...,m.
/* Modify the Stirling computation to compute the probabilities, which obey the following recurrence relation: P(n,k) = P(n-1,k) + ((k-1)/k)##(n-1) # P(n-1, k-1); = P(n-1,k) + (1-1/k)##(n-1) # P(n-1, k-1); \--------------v------------/ = P(n-1,k) + T; You can apply the exp-log trick to the second term: T = exp( (n-1)*log(1-1/k) + log(P(n-1,k-1)) ) To compute log(1-1/k) accurately, you can use the LOG1PX function https://blogs.sas.com/content/iml/2023/10/11/taylor-pade.html */ start Prob_k(n, k); if k <= 0 | k > n then /* Handle edge cases */ return(j(n, 1, 0)); P = j(n, k, 0); /* matrix to store the probabilities P(i,j) for i=1..n, j=1..k */ /* Base case: P(i,1) = 1 for all i >= 1. "The probability of observing 1 group after any number of draws is 1." */ P[,1] = 1; /* Apply the recurrence relation to compute P[i,j] from P[i-1,j] and P[i-1,j-1] */ do i = 2 to n; j = 2:min(i,k); /* P(i,j) is 0 if i < j, so stop at j=i */ logFactor = (i-1)*log1px(-1/j); T = exp( logFactor + log(P[i-1, j-1]) ); P[i,j] = P[i-1,j] + T; end; return P[,k]; /* return k_th column of matrix */ finish; /* Probability that a school of size n covers all 365 birthdays */ k = 365; n_draws = 4000; P = Prob_k(n_draws, k); title "Probability That All 365 Birthdays Are in the School"; call series(1:n_draws, P) other=" xaxis grid values=(500 to 4000 by 500) label='Number Students in the School'; yaxis grid min=0 max=1 values=(0 to 1 by 0.1) label='Prob(All Birthdays)';"; |
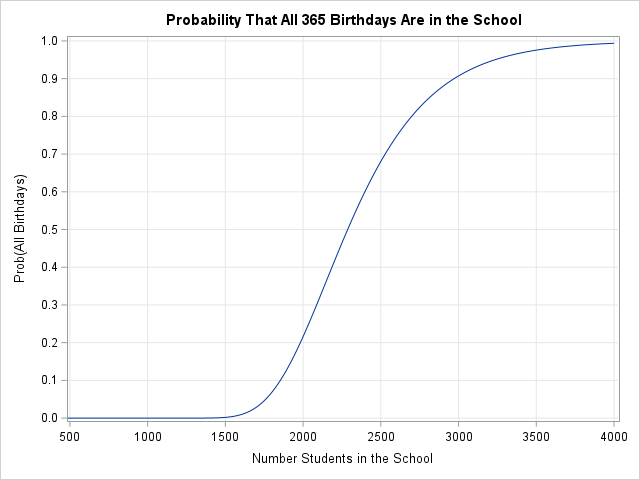
This graph can be used by schools of various sizes to estimate the probability that all 365 possible birthdays are represented by the student body. For my friend's school (n=900), the probability is almost zero. The second section of this article shows a table of probabilities for schools of different sizes. In addition to listing sizes in increments of 500, I included two special sizes: a school that has 2,287 students has a 50% chance of covering all birthdays; a school that has 2,700 students has an 80% chance.
Summary
The coupon collector's problem is fascinating, but the math is challenging. This article was motivated by a middle-school girl who noticed that the principal sometimes announced, "No student is celebrating a birthday today." This article shows that this is a common occurrence in schools that have 1,500 students or less. It is rare event in a school that has 3,000 students or more.
The article shows how to compute the probabilities for this problem in SAS by using Stirling numbers of the second kind. Because the quantities for this computation are very large, you need to use techniques in numerical analysis to obtain accurate probabilities. The techniques include taking advantage or recurrence relations, the exp-log trick, and using the LOG1PX function to accurately compute the logarithm of a number close to 1.
If you prefer computer simulation to math, see my previous articles on simulating rolling a six-sided die and simulating the coupon collector's problem.
Appendix 1: A recurrence relation for probabilities in the coupon collector's problem
Define the P(n,k) to be the probability of observing drawing all k coupons by the n_th attempt:
\(
P(n,k) = P(X \leq n) = k! S(n,k) / k^n
\)
You can solve this equation for S(n,k) in terms of the probability:
Recall that Stirling numbers obey the following recurrence relation:
\(S(n+1, k) = k S(n,k) + S(n,k-1) \quad \text{for } 0 \le k \le n
\)
If you solve the first equation for S(n,k) and substitute the expression
\(
S(n,k) = k^n P(n,k) / k!
\)
into this formula, you obtain a recurrence
formula for the probabilities:
\(\begin{array}{ll}
P(n+1, k) & = P(n,k) + \left(\frac{k-1}{k}\right)^n P(n,k-1) \\
& = P(n,k) + (1 - 1/k)^n P(n,k-1)
\end{array}
\)
To obtain a numerically stable and accurate computation, you should evaluate the last term
by using the exp-log trick:
\(\begin{array}{ll}
(1 - 1/k)^n P(n,k-1) & = \exp\left(
\log((1 - 1/k)^n) + \log( P(n,k-1) )
\right) \\
& =
\exp\left(
n \log(1 - 1/k) + \log( P(n,k-1) )
\right)
\end{array}
\)
Because 1/k is small, you should use the LOG1PX function in SAS to evaluate log(1 - 1/k) accurately.
Appendix 2: Asymptotic expectation
This article shows that, for each n, you can compute the probability distribution for the school-birthday problem.
The expected value of this distribution is asymptotic to
\(E[k]= k \log(k) + \gamma k + 0.5
\)
where γ ≈ 0.5772156649 is the Euler–Mascheroni constant. Thus, returning to dice and faces for a moment,
it's straightforward to estimate the
number of rolls that are expected before all faces of a k-sided die are observed:
/* The EXPECTED number of random draws before all groups are observed is asymptotic to E[k] = k*log(k) + \gamma*k + 0.5 */ gamma = constant("Euler"); k = {30, 52, 100, 365}; Expected = k#log(k) + gamma*k + 0.5; print k[L="Num Faces"] Expected[F=best6.]; |
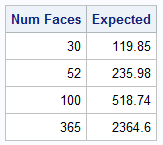
The expected value is larger than the value for which there is a 50% chance. Expected values are useful when you want to estimate the number of rolls before all faces are observed. I included the value 52 in the table because there are 52 unique cards in a standard playing deck. If you shuffle many decks of cards together (like 15 decks) and start dealing from the top of the tall stack, it is expected that you will have to deal 236 cards before you have "collected" all combinations of the 13 ranks and 4 suits.

2 Comments
If I can suggest a follow up post Rick -- I would be interested in a simulation approach to figure out the probability just limiting to school days. So you have birthdays not on school days, and fewer days to fill in. So not clear to me how the solution holds exactly for the more restricted question "should there be a birthday on everyday we are in school".
Also given the large number of permutations and low probabilities, figured you would have some good insight to share on simulating a solution, checking its accuracy, now many iterations needed etc. (assuming a closed form formula is not possible).
Thanks for writing. The simulation is straightforward. For a school with n students, simulate n numbers in the range 1-365. If there are 185 school days, ask whether all the numbers in the range 1-185 were generated. If so, add 1 to a count. Repeat B times (eg, B=1E5) and return the proportion of samples for which all numbers in the range 1-185 were generated.
Since the student birthdays only need to "cover" 185 school days instead of 365 days, the probability of covering all 185 school days is higher than the probabilities reported in this article.
For example, a school of size n=2050 has a 50% chance of having birthdays on every school day. A school of 2450 has an 80% chance.
The precision of a Monte Carlo simulations is proportional to 1/sqrt(B), so B=100,000 gives 2 to 3 digits of precision.