A Stem and Leaf plot is a visual that can help quickly visualize the distribution of the data. This graph was particularly useful before the advent of modern statistical graphs including the Histogram and Box Plot. One nice feature of the plot is it shows the actual values in the data. Clearly, this visual works well for moderate amount of data of 10-100 observations, and can quickly get cluttered for larger data.
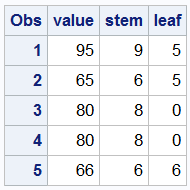
For this article, I used the RANNOR() function to simulate some test score data for a class or about 15 students. Keen observers may notice that I have less than 15 observations in the data. This is because while I loop from 1 to 15, I keep only the values > 0 or < 100, so the actual number of observations may be less. The data is prepared for plotting by first sorting the data by score and then extracting the Stem and Leaf value as shown in the linked full program below. For the test values below 100, Stem=Value/10 and Leaf=Value-Stem*10. Leaf values that belong to same stem are given increasing x values for plotting. The data is shown below that includes the raw "Value" and the computed "Stem" and "Leaf" columns, followed by the plot and the SGPLOT code.
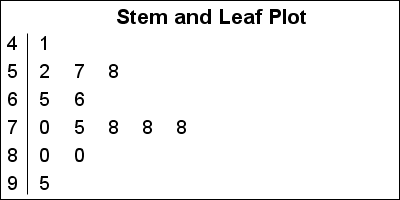
title 'Stem and Leaf Plot'; proc sgplot data=stemleafGraph noautolegend noborder; text x=x y=stem text=leaf / textattrs=(size=9) strip; xaxis display=none offsetmin=0.05 max=10; yaxis display=(noticks nolabel) integer values=(4 to 9 by 1) reverse fitpolicy=none; run; |
This code uses the TEXT plot to display the values. For pre SAS9.40M3 release, you can use the SCATTER plot as shown in the linked code.
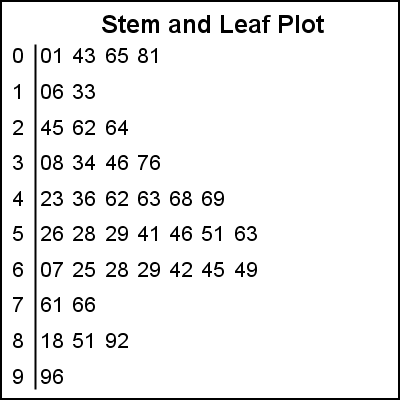
When the data values become bigger, one needs a different technique. For that case, I generated a data set with about 50 values ranging from 0-999. Once again, the number of observations may be < 50 because even though I loop from 1 to 50 in the code, I keep only observations > 0 or < 1000. In such a case, there are multiple ways to extract the Stem and Leaf values. One could extract two digits for the Stem, with one digit for Leaf. For data with a large spread (0-999) this could result in a very tall graph to display all 100 values of Stem.
For this data I extracted only 1 digit for the Stem, and retained the remaining digits for Leaf. This results in a plot with 10 "bins", with a list of values per bin. The plot is shown below. The SGPLOT code is very similar as before.
It would be easy to convert the code into a macro to handle different cases. I will leave that as an exercise for the motivated reader.
SAS 9.40M3 SGPLOT code: Stem_Leaf

8 Comments
Thanks for this, Sanjay. This has been on my "to do" list for a while, but I never got around to it.Stem and leaf plots are used in high school AP Statistics and other introductory courses that examine small data sets.
Thanks Rick. I have been told this plot is one of the first introduced to Statistics students.
This plot is useful to identify non-continuous variables because the digits are visible. If people are rating in percentages they tend to use multiples of 5 except near the ends of the scale. This can usually be seen immediately in a SL plot.
Although this is an interesting exercise, for practical purposes it is a little redundant as PROC UNIVARIATE can produce such a plot directly, albeit as line printer output.
Just a fun application of existing SGPLOT feature set to create a graph often introduced in High School statistics courses.
I should also mention that Warren Kuhfeld shows how to create a stem-and-leaf plot on p. 60 of his book Advanced ODS Graphics Examples.
Pingback: Basic ODS Graphics: Axis Options - Graphically Speaking
I am a first time SAS user taking a course. Using SAS, how do I produce a stem and leaf plot without doing coding? What do I click? Is it under box plot? Thanks
Hi Lisa, I'm not sure there is a code-free solution. However, PROC UNIVARIATE supports this with a simple option. Ironically, you need to *disable* ODS graphics to get this -- it's a text-based plot. Sample in this community discussion.