 I’ve been giving presentations about SAS® ViyaTM for a couple of months now, and the reactions have been positive. I’m part of a much bigger cast of speakers at SAS who talk about the new analytics platform with key customers and analysts. While some presenters focus on the overarching benefits or the integration with previous versions of SAS, I get to focus on hands-on demonstrations. My style is to show SAS Viya technology in use, which helps attendees understand the different user experiences.
The demonstrations I show use anywhere from 90,000 to 2.5 million observations. Sometimes I’m looking for fraud or sometimes I’m looking for opportunities to reduce attrition. No matter what business problem I’m trying to solve, I like to show four different ways to tackle the problem, depending on the user persona and skillsets.
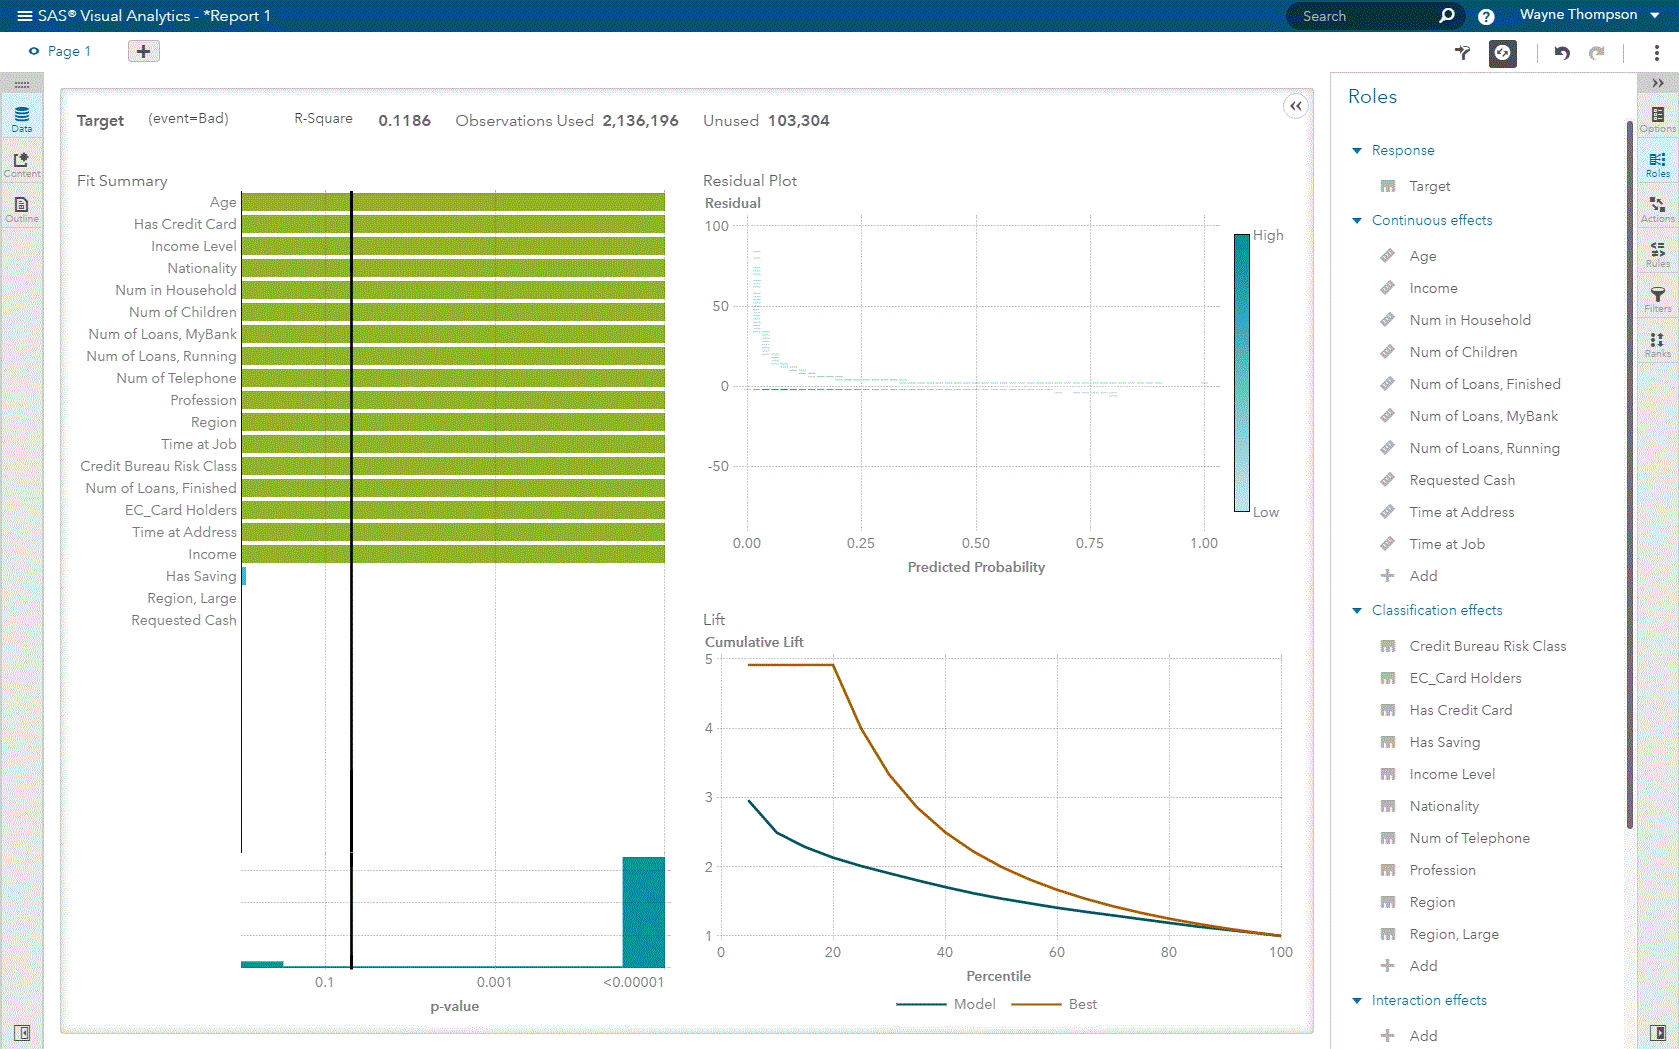
First, I show SAS® Visual Statistics. This is a suitable interface for business analysts and citizen data scientists. I can point and click to do a logistic regression and find an answer. Or, I can start to explore my data with SAS® Visual Analytics before I do any modeling.

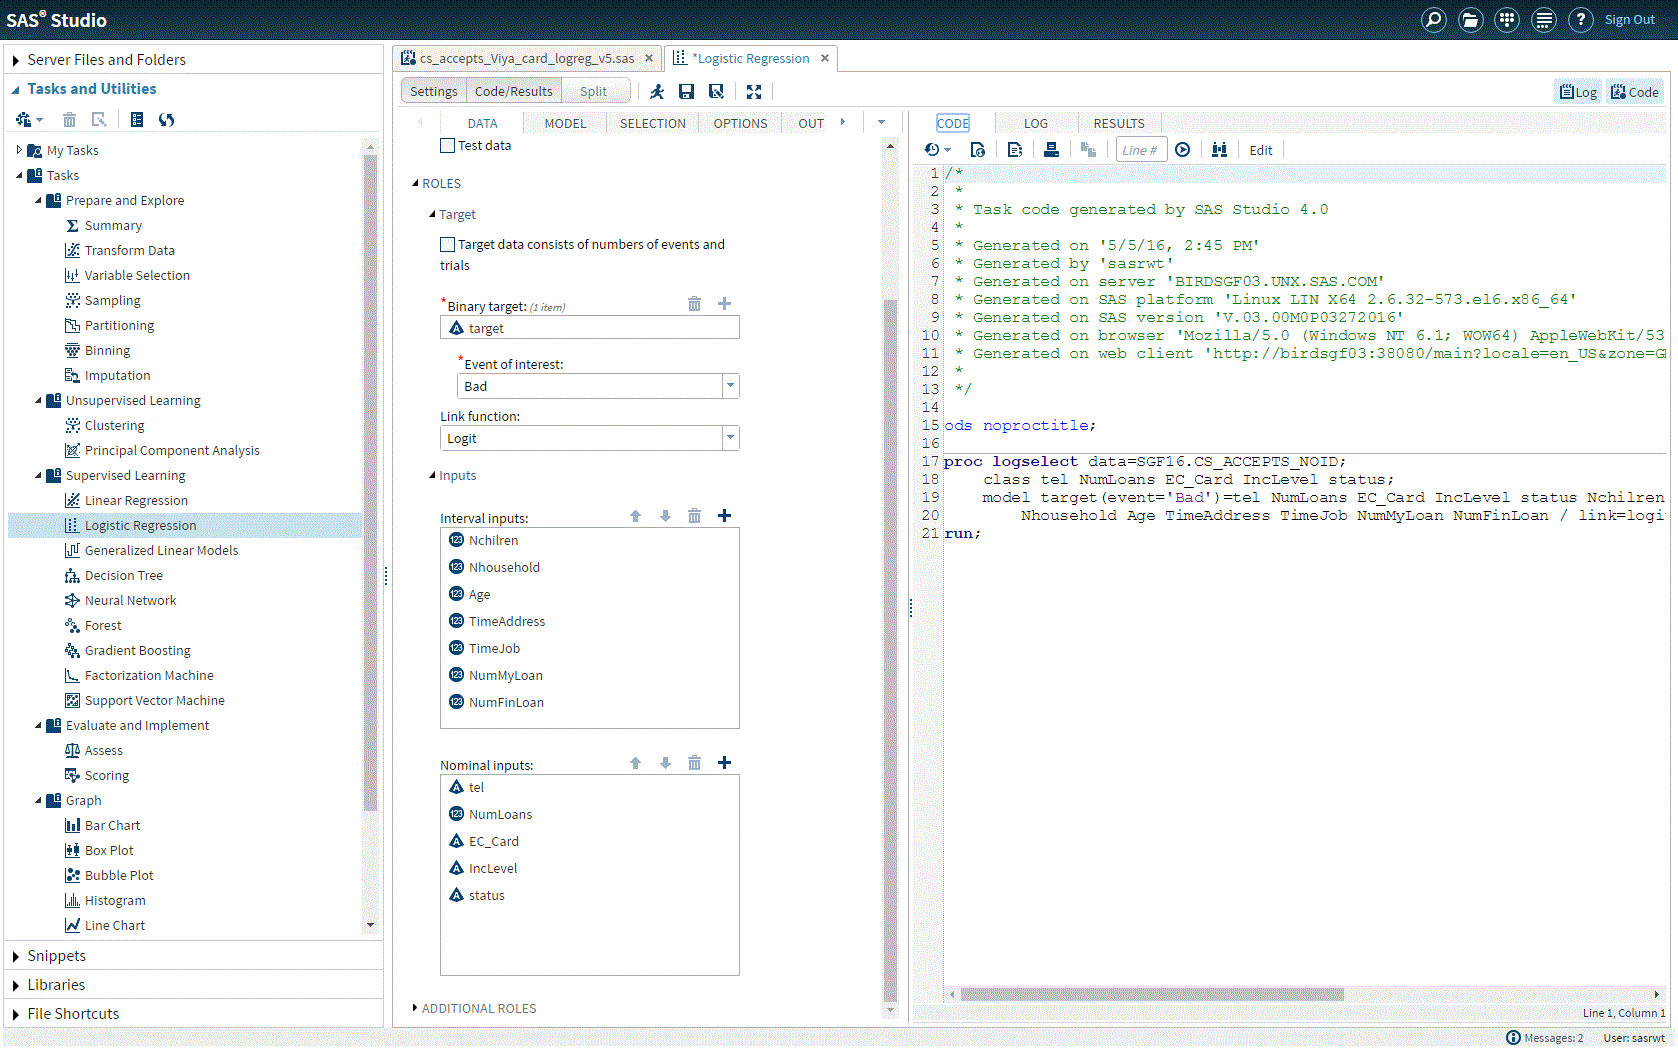
Next, I show SAS® Studio, where you can also point and click, or you can program SAS code. You can do both here, or toggle back and forth, which provides a lot of benefits when reviewing how your code works. Here, I run a logistic regression, write the procedure and use PROC LOGSELECT, which is the logistic procedure in SAS Viya. I also point out all of the exploratory and descriptive tasks and procedures you can use before fitting your model.

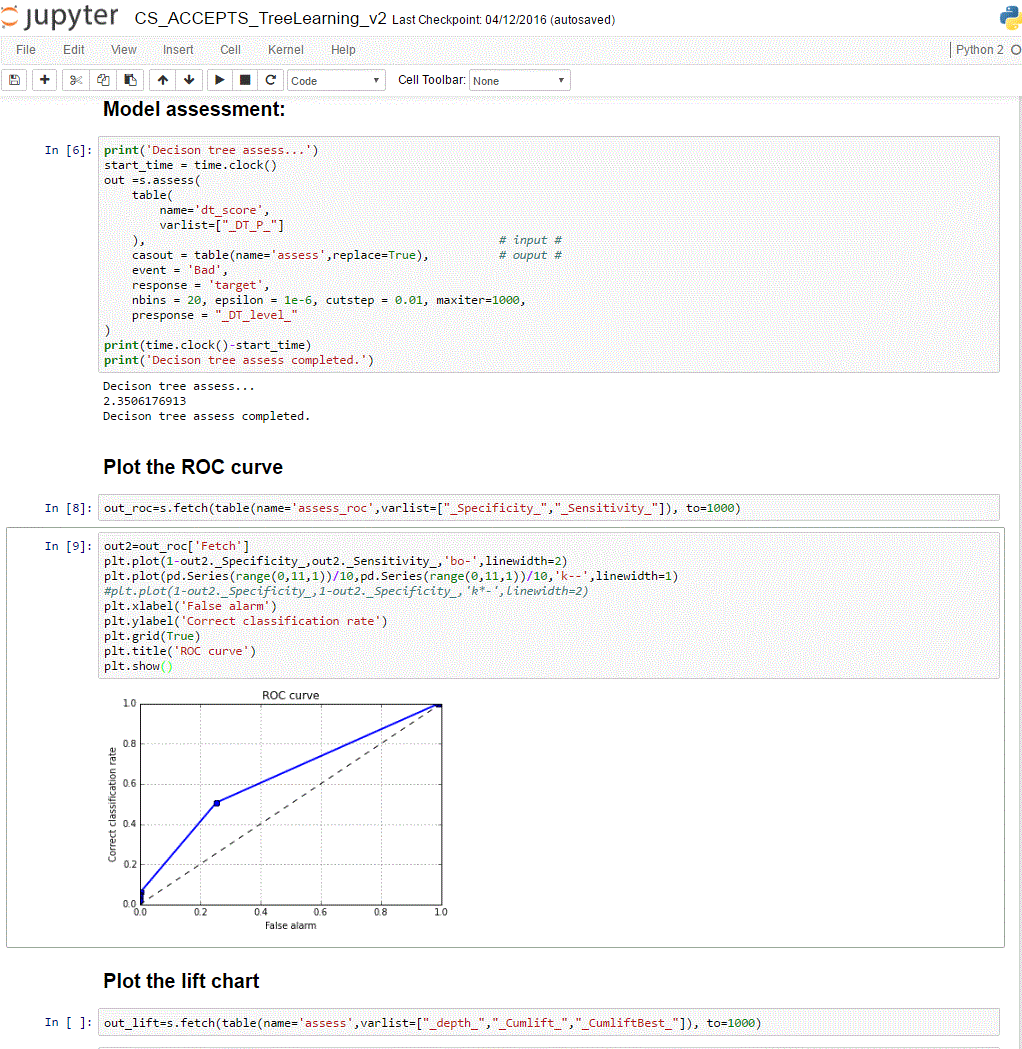
Then, I tab over to Jupyter Notebook and show the CAS Python API. (CAS is short for cloud analytic server.) I can write Python code that calls specific CAS actions, like calling the logistic action set or performing model assessment. The CAS Python API is not yet released but will be available later this year.

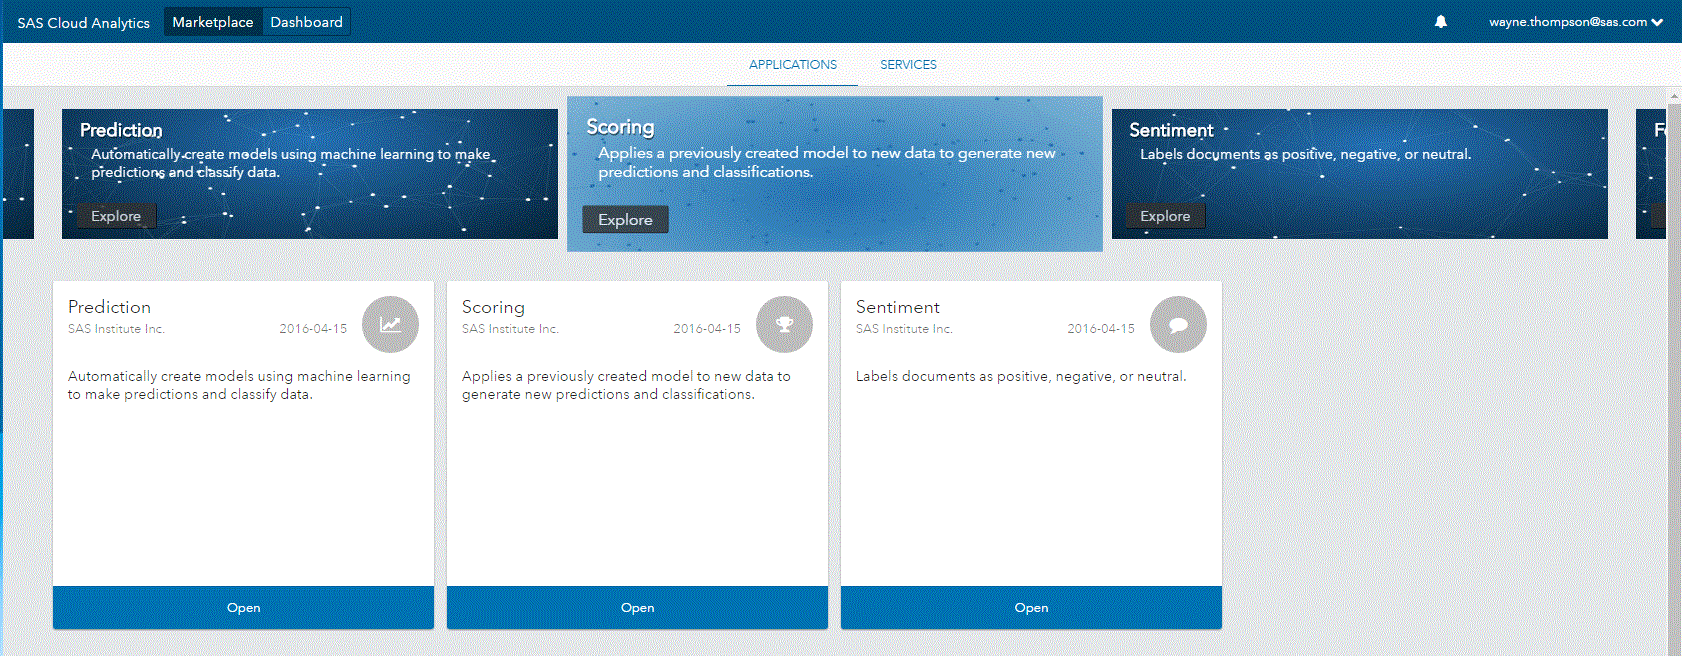
Finally, I like to show these prepackaged predictive models that run SAS through APIs. Using analytics as a service by SAS, these APIs can be used to embed logistic regression or other modeling techniques into any other application.

I use the same data for all of the examples and because the same CAS action set is used for analysis you get the same results. For each one, SAS Viya goes right to the data and lifts it up into memory. I can perform my analyses quickly and nimbly, and when I’m done, the data dribbles back down to its initial location instead of proliferating copies of the data on hard disks.
Not only is it quick and easy to get complex answers – but you can get them in whatever way feels most comfortable to you.
Which of the four do you prefer? And what ideas do the different options inspire in you?

5 Comments
Wayne,
Thanks for your very informative and interesting presentation on AI at the SAS User Group Westwood meeting. My interest is in learning more about predictive outcomes for behavioral health clients based on different treatment procedures and/or medications as that relates to different client groups such as age, gender, ethnic background, family size and income and etc.
Wayne,
Did you attend Berea College in the early 80's? If so I was a classmate of yours.
Amy Haney
Berea College Alumni
1980-84
Is there a direct correlation between SAS Grid and SAS Viya?
Is SAS Viya the next evolutionary step beyond SAS Grid that would be different than SASGrid in a cloud architecture?
SAS Viya can be deployed in either a single node architecture (Symmetrical Multiprocessing - SMP) or multi-node architecture (Massively Parallel Processing - MPP). So, SAS Grid would compare with SAS Viya MPP.
Both grid architectures are aimed at the same thing - distribute the workload across multiple machines (nodes) in an effort to increase execution speed, capacity and availability. The difference is in how that is accomplished.
SAS Grid distributes the workload across the worker nodes in a task-parallel mode. That is, divide the work such that worker nodes can accomplish different tasks in parallel. Users coding in SAS can take advantage of this with specific SAS Grid statements that separate their code into tasks that can be executed in parallel. SAS Enterprise Guide, for example, does this automatically.
SAS Viya MPP distributes the workload across the worker nodes in a data-parallel mode by default. This works especially well with in-memory processing of big data. In data-parallel mode, the data is distributed across multiple worker nodes. When an action executes, all nodes perform the action on the same data tables, but on different rows. The partial work on the rows located on a node results in a partial answer. The summary results from a single node need to be combined with the results from other nodes to produce the answer that represents all of the data.
It's important to note that SAS Viya MPP can also distribute work in task-parallel mode.
Hope this helps.
Looking forward to getting the early adopter and trying the software out. Interested in using SAS Visual Analytics and SAS Studio!