 You may have noticed that when using date information in SAS Visual Analytics, that the date data values can be displayed in a variety of ways. You may see your dates displayed like Jan1916, 03Jun1915, or 03/12/16, for example. In this blog I’ll help you understand SAS date and time values, and review some of the features of SAS Visual Analytics relating to date and time values.
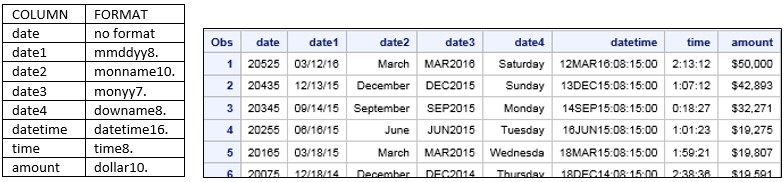
To help illustrate some of the date features in Visual Analytics Designer, I’ve created a SAS table containing multiple date columns, each containing the same data values, but having different associated formats, along with a datetime column and a time column with associated formats. For analysis purposes, there is also an amount column.
The following figure shows how the data is stored and how the data values would be represented in a simple printed report, for example.
How date and time formats are used in designer
When the table is loaded to memory and added to a designer report as a data source, the columns with date, datetime, and time formats are interpreted as date, datetime and time category data items, as shown in the next figure. Notice that the date column with no format, however, is interpreted as a numeric measure data item. The formats in designer are as shown below.
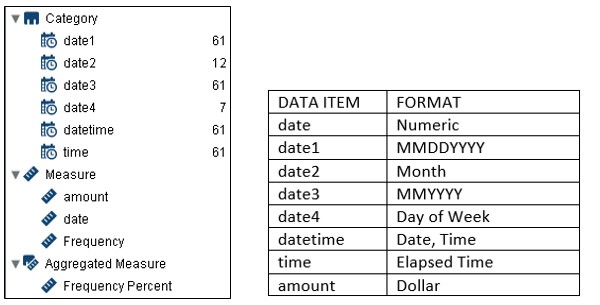
This is a list table showing how the values display with the associated formats.
So what are those numbers in the date column all about?
The numbers in the date column represent a SAS data value with no format associated. This means it is simply a numeric value representing ‘number of days’. Date values are stored internally as numbers in order to enable calculations on dates, such as the number of days between two dates.
A SAS date value is a numeric value representing the number of days between January 1, 1960 and a specified date.
A SAS datetime value represents the number of seconds between January 1, 1960 and a specified date and time.
A SAS time value represents the number of seconds since midnight of the current day. These values are between 0 and 86400.
For SAS tables, however, date values can be displayed using a variety of different formats (almost 100!) There are numerous formats available for displaying datetime and time values also. You are able to take advantage of many of these formats in SAS Visual Analytics—because, after all, who really wants to sit around counting the number of days in order to interpret date values in a report?
Changing the date and time formats in designer
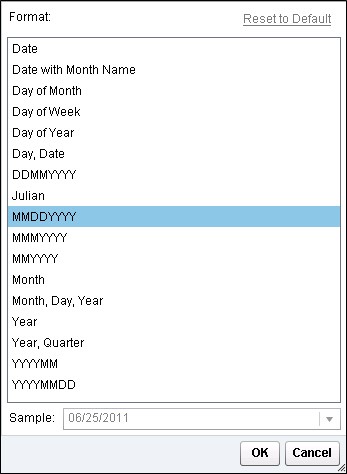
When changing the format for any of the date data items, you can choose from this list:
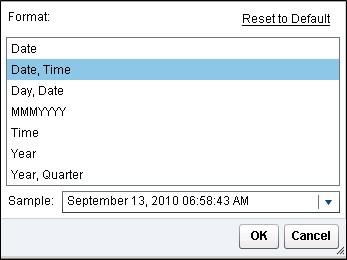
Changing the format for the datetime data item displays this list:
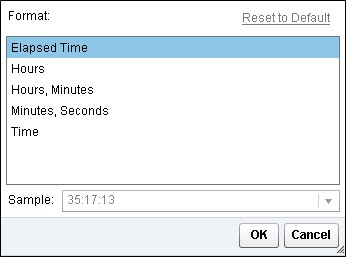
A data item with time information stored can use these formats:
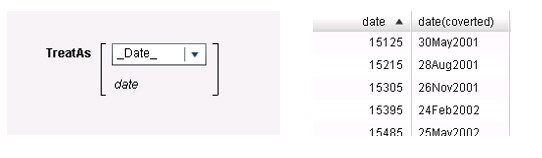
Another problem to consider: Suppose your date information was loaded to memory without an associated date format at all, in the case of the date column in the data above. This is column is interpreted in designer as a numeric data value. You can solve this problem easily by creating a new calculated data item using the TreatAs Numeric(advanced) operator. The operator enables you to specify a calculation that treats a value as a different data type. In this case, the expression below specifies that the date data item should be treated as a date value. The values of the new date(converted) data item are shown below. You can also then change the format of the new date(converted) data item if you wish.
Date hierarchies in designer
In designer you can create a default date hierarchy from any date or datetime data item whose format displays a year by simply right-clicking on the data item and selecting the Create Date Hierarchy option. A date hierarchy consists of year, quarter, month, day. To create a time hierarchy right-click on a time data item and select Create Time Hierarchy. The time data item results in a hierarchy of hour, minute, second.
These hierarchies are the default hierarchies created for the date1, date3, and time, and datetime data items from the example data above.
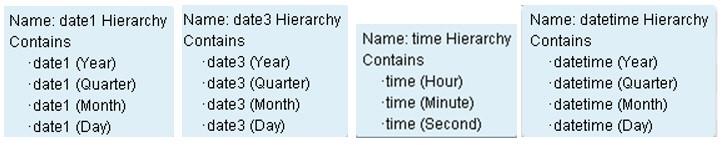
Note: You may have noticed that, in explorer, for a datetime item, you have the option of creating a Date and Time Hierarchy for that data item, consisting of Year, Quarter, Month, Day, Hour, Minute, Second. The Date and Time Hierarchy is not available in the designer. So the default hierarchy for the datetime data item above consists of only Year, Quarter, Month, Day—the same as for the date1 and date3 hierarchies.
If the format associated with a date only displays Month, (the MONTH. Format associated with date2, for example), then in designer, you won’t be able to create a hierarchy from the data item until you change the format to one that displays year also. If a hierarchy is not supported for a data item, then the Create Hierarchy option is not displayed when you right-click on the data item.
Derived data items for measure based on data or time intervals
Having data items whose format displays a year value also enables you to create derived items for reports that are based on time intervals. When you click on one of the intervals below, a selection list of data items display. The only data items that are supported for the intervals are those that contain a year—so that’s data1, data3, and datetime in this data.
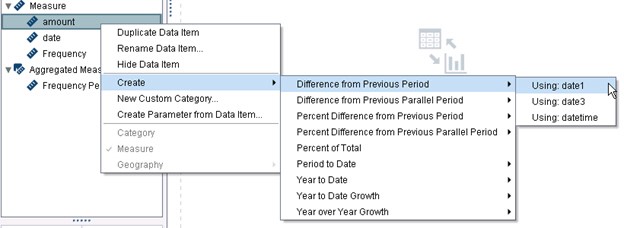
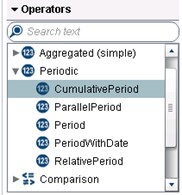
The formulas for these derived items use periodic operators that aggregate values over time: RelativePeriod, ParallelPeriod, and CumulativePeriod.
The special derived data items feature creates the formulas for these aggregations for you, but the same Periodic operators are also available for creating your own New Aggregated Measures:
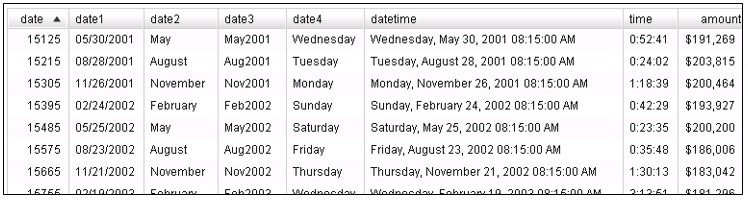
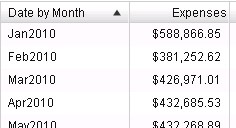
Some of these derived columns are illustrated here using data that contains a Date by Month data item and an Expenses data item. The data spans 2010-2011.
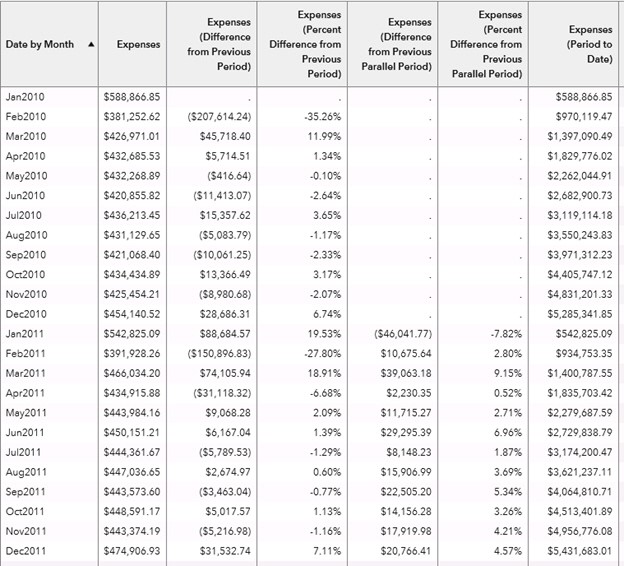
You can edit each of the derived data items to view the calculation and to make changes, if necessary.
The calculation for Expenses(Difference from Previous Parallel Period) is shown below, as an example.
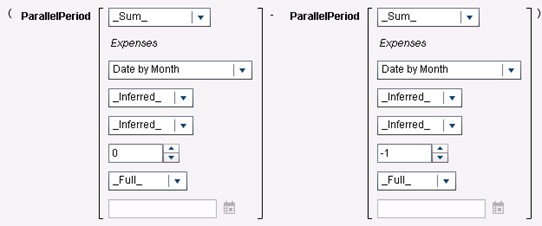
_Sum_ is the aggregation that is applied to the measure, Expenses.
The data item for the periodic calculation is Date by Month.
The inner interval (smaller time period) for the aggregation is _Inferred_ , which means it has been determined from the report object. You could change to specific values of _ByMonth_ , _ByQuarter_ , or _ByYear_ .
The outer interval (larger time period) is also _Inferred_ , with other possible values being _ByMonth_ , _ByQuarter_ , or _ByYear_ .
The number of outer intervals to offset from the current period is 0. This means that the period from the current outer interval (Year) is used.
The scope for the period is _Full_ , meaning that the values are aggregated for the entire period. Alternate values are _ToDate_ (up to a specific day in the current period), or _ToToday_ (aggregates only up to the equivalent of today’s position in the current interval). If you change the scope to _ToDate_ , you would need to specify a specific date in the last field.
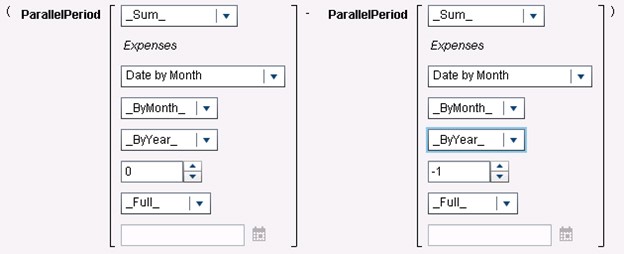
So considering the above descriptions, for the list table, the expression below would produce the same resulting values for Expenses(Difference from Previous Parallel Period).
Periodic operators can return missing values under certain scenarios. These scenarios, along with complete details on all of the date operators are documented Appendix 5 of the SAS Visual Analyics 7.3: User’s Guide.
Hopefully, this blog provides you with a better understanding of the basics of dates and times, and enable you to use some of the great features for dates in SAS Visual Analytics.

16 Comments
i want calculate days of delivery from two columns date_of_delivery and date_order_was _placed . how can i do ?
the big problem with date in SAS Visual Analytics that I have is Time Series graph. It sounds there is no way to show the Month on the X Axis i.e. Sep 18, Oct 18 and instead it shows the first day of the month even your date ONLY end of the month i.e. 30 Sep 2018. Is there any facility in SAS VA to be able to show the Month-Year in correct order for example a bar chart/time series showing Income over months?
Correction:
thats true but i want the results displayed in hh:mm:ss format and total displayed at bottom which i believe is not possible if the column is defined as time/date category. eg if the time column has value 3600, i want to display in hh:mm:ss format (1:00:00) and get the total at the bottom
time
0:10:00
0:12:10
-------
total =0:22:10
Very informative piece of work ! A rookie like me is grateful for all these explanations.
I have a simple request about time datas that sas Belgian cnsultants can't seem to answer. In a table I have a duration column, format TIME8. I simply need to sum these durations but keeping the time format. Let's say I work on Task A during one hour and a half (01:30:00) then on task B during 00:30:00 min. Then again on task A during 00:15:00. I need to sum 01:30:00 + 00:15:00 for task a and 00:30:00 for task b. As my column is defined as time, Visual Analytics makes it a category (elapsed time) which cannot be summed. When I use TreatAs I end up with decimals, which is confusing : 01:06:00 is 1.10. Would you by chance have any solution ? TIA
Phil, the result is indeed as you describe, and we have not found a workaround for this one!
Thank you Bobbie for taking the time to answer my question. I think that "enhancement request" is my friend... I can't figure out why SAS didn't think of such a basic calculation ! Especially at a version 7 stage. Thanks again.
Hi,
In VA you have a magic word, it's "TreatAs". Create a calculated item.
So you want to sum some time columns? No worries, select the calculation : '+' and then go in the selection left and look after the TreatAs operation. drag it twice and add your columns you want to sum. my example is a date but it's the same : TreatAs(_Number_, 'year'n) + TreatAs(_Number_, 'year'n)
and now you need to put a TreatAs on top of whole the calculation and tell him it's a time.
job is done 😉
in text editor it gives this :
TreatAs(_Time_, ( TreatAs(_Number_, 'year'n) + TreatAs(_Number_, 'year'n) ))
year is a data column.
good article, what if you have to summarize the column to get all the total at the bottom. Since the column is defined as category, i don't think the column can be summarized Like total_time=
Salman, I assume you are referring to the date column (or a time column). You would need create a calculation using the TreatAs operator to treat the date or time values as numeric. Then you would be able to do calculations or aggregations on the column values.
thats true but i want the results displayed in hh:mm:ss format and total displayed at bottom which i believe is not possible if the column is defined as numeric (measure)
thanks for your comment
Thanks for the good article! I also noticed that the Date and Time Hierarchy is not available in Designer. Is there a workaround?
One workaround in the designer would be to use your datetime value to create a date hierarchy. Then create a calculated data item consisting of the timepart of your datetime value. You can then duplicate your timepart data item with an hour format and another with an hour,minutes format. Then add these new data items to your date hierarchy.
Really interesting thank you.
We have some reporting based on things like week (defined as Monday to Sunday) versus previous week and days versus 364 days previous (same day of week, previous year) and wondered if anyone had found approaches to do this without creating that data before loading?
Rob, for a very simple example, consider a table that contains a Transaction Date column and an Order Total column. Each row represents the order total for a transaction date. Create a report containing a text input control where the user can type in a transaction date and a list table that displays two columns: Transaction Date and Order Total. The table will display two rows containing the order totals for the user-specified date and the date one year earlier.
Here is what makes it all work:
The text input field supplies the value for a character parameter, DateParameter.
The list table has this advanced filter:
( Ref Date = Transaction Date ) OR ( Ref Date (yr-1) = Transaction Date )
Ref Date is a calculated data item represented by this expression:
Parse('DateParameter'p, 'ANYDTDTE18.')
Ref Date (yr-1) is a calculated data item represented by this expression:
TreatAs(_Date_, ( TreatAs(_Number_, 'Ref Date'n) - 364 ))
Hope this example helps.
Great article, thank you!