 Many users of ODS Graphics will be excited to learn that, beginning with SAS® 9.4 TS1M3, SG procedures are able to recognize formatted values that contain Unicode values. One benefit of this is that it allows you to include, without using annotation, special symbols such as greater-than-or-equal-to signs or Greek characters in your axis tick-mark values. You have also asked for syntax which can more easily assign colors to your graphs without having to define a style using PROC TEMPLATE. In this blog, we take a closer look at syntax that you can use to accomplish both of these tasks for PROC SGPLOT. We'll also discuss syntax that produces similar results with the Graph Template Language (GTL).
Recognizing Formatted Values That Contain Unicode
For example purposes, I want to produce a box plot that looks at the levels of cholesterol across patient ages. My program, below, uses a data set called sashelp.heart, which contains values for each patient’s age at the start.
proc sort data=sashelp.heart out=heart;
        by ageatstart;
      run;
proc sgplot data=heart ;
Title1 "Cholesterol Level by Age Range";
   vbox cholesterol / category=AgeAtStart ;
run;
By default, when I submit the program, I get a box for each value of AgeAtStart that is in the data set sashelp.heart.
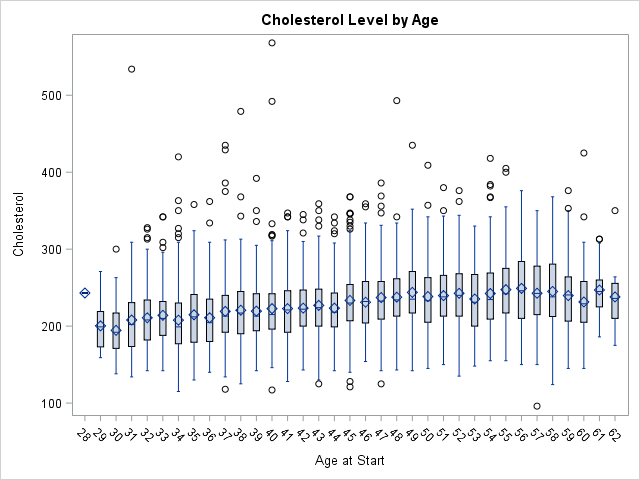
Wow, that’s a lot of boxes. This chart is crowded and hard to read.
Now, let’s group the boxes into age ranges using a format I created called AGEFMT. Each formatted value should display the lower and upper ages of the range separated by a greater-than-or-equal-to sign. Note that to display the greater-than-or-equal-to sign, I need to use the Unicode value 2264. And because ODS Graphics does not recognize the escapechar, I use (*ESC*) in my format definition.
proc format;
value agefmt
20-30 = "20 (*ESC*){unicode '2264'x} 30"
30-40 = "30 (*ESC*){unicode '2264'x} 40"
40-50 = "40 (*ESC*){unicode '2264'x} 50"
50-60 = "50 (*ESC*){unicode '2264'x} 60"
60-70 = "60 (*ESC*){unicode '2264'x} 70"
;
run;
proc sgplot data=heart ;
Title1 "Cholesterol Level by Age Range";
vbox cholesterol / category=AgeAtStart ;
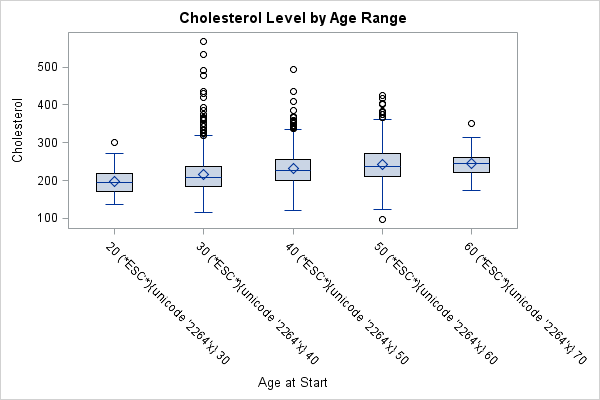
format ageatstart agefmt.;
run;If I use SAS 9.4 TS1M2 or earlier to submit my program, the results look like the following. Notice that the Unicode values in the PROC FORMAT do not resolve in the output produced by PROC SGPLOT like they do for the Base SAS® procedures. Prior to SAS 9.4 TS1M3, I would need to use annotation in order to display axis values that contain Unicode values. (Sample 48123 illustrates the syntax.)
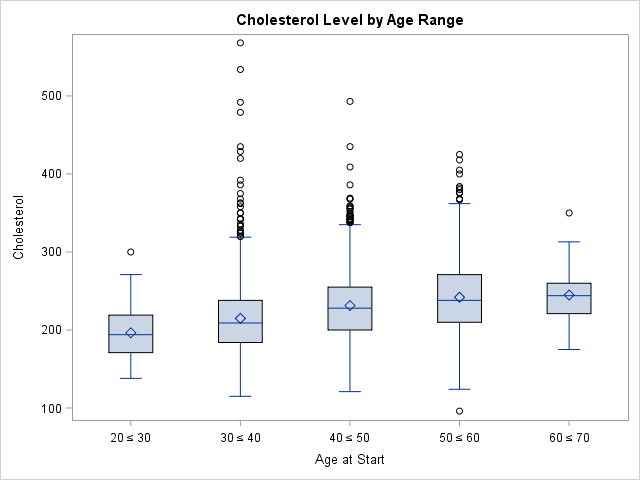
Fortunately, these issues disappear with SAS 9.4 TS1M3. When I submit my modified program, my results look much better:
An Easier Way to Assign Colors to Your Graphs
I want each box to be a different color, so I will add the option GROUP=AgeAtStart to my VBOX statement.
proc format;
   value agefmt
   20-30 = "20 (*ESC*){unicode '2264'x} 30"
   30-40 = "30 (*ESC*){unicode '2264'x} 40"
   40-50 = "40 (*ESC*){unicode '2264'x} 50"
   50-60 = "50 (*ESC*){unicode '2264'x} 60"
   60-70 = "60 (*ESC*){unicode '2264'x} 70"
   ;
run;

proc sgplot data=heart ;
Title1 "Cholesterol Level by Age Range";
   vbox cholesterol / category=AgeAtStart group=AgeAtStart ;
format ageatstart agefmt.;
run;
In addition to each box being represented with a different color, a default legend is also displayed.

I am going to suppress the legend by adding the option NOAUTOLEGEND to the PROC SGPLOT statement. I also want to change the default colors for the boxes. Prior to SAS 9.4 TS1M0, I would have had to do this through an attribute map definition or a style definition like this one:
proc template;
define style colors;
parent=styles.htmlblue;
class graphdata1 / color=red;
class graphdata2 / color=green;
class graphdata3 / color=purple;
class graphdata4 / color=orange;
class graphdata5 / color=cyan;
end;
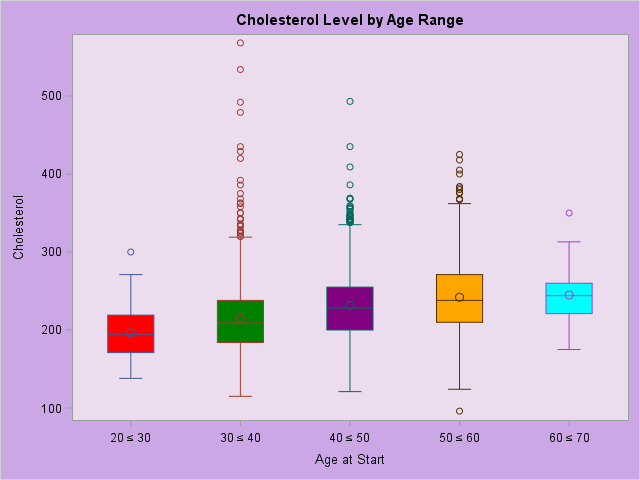
Beginning in SAS 9.4 TS1M0, I assign the colors with the DATACOLORS option in the STYLEATTRS statement in PROC SGPLOT. In addition to changing the fill color of the boxes, I change the color of my graph background and the plot wall area with the BACKCOLOR and WALLCOLOR options, respectively, in the STYLEATTRS statement. Here is the final code:
proc format;
   value agefmt
   20-30 = "20 (*ESC*){unicode '2264'x} 30"
   30-40 = "30 (*ESC*){unicode '2264'x} 40"
   40-50 = "40 (*ESC*){unicode '2264'x} 50"
   50-60 = "50 (*ESC*){unicode '2264'x} 60"
   60-70 = "60 (*ESC*){unicode '2264'x} 70"
   ;
run;
proc sgplot data=sashelp.heart noautolegend;
Title1 "Cholesterol Level by Age Range";
   styleattrs datacolors=(red green purple orange cyan) backcolor=vpav wallcolor=pwh;
   vbox cholesterol / category=AgeAtStart group=ageatstart ;
format ageatstart agefmt.;
run;
This is the final graphics output:
Using GTL to Create the Same Graph
The syntax below creates this graph using GTL. The color-fill assignments are made using the DATACOLORS option in the BEGINGRAPH statement. The BACKGROUNDCOLOR option in the BEGINGRAPH statement specifies the background color, and the WALLCOLOR option in the LAYOUT OVERLAY statement defines the color of the axis wall.
proc template;
 define statgraph boxes;
 begingraph / datacolors=(red green purple orange cyan) backgroundcolor=vpav;
    layout overlay / wallcolor=pwh;
     boxplot x=AgeAtStart y=cholesterol / group=AgeAtStart;
  endlayout;
 endgraph;
 end;

proc sgrender data=sashelp.heart template=boxes;
Title1 "Cholesterol Level by Age Range";
format AgeAtStart agefmt.;
run;

7 Comments
I have tried a whole range of ways to get superscript -1 (combining {unicode '207b'x}{unicode '00b9'x}) but I can't get it to work! I've played with the spaces, the x's and I'm out of ideas. Any thoughts?!
Below is a modified version of the SAS program where the first range includes a superscript -2: In this case I added a new style definition that includes Unicode fonts so the values are resolved correctly in the graph. In addition to defining the style you need to point to the style on your ODS destination statement. In my example, that is the ODS HTML statement.
proc template;
define style unifonts;
parent=Styles.htmlblue;
style Graphfonts from GraphFonts /
'GraphValueFont' = ("Monotype Sans WT J",12pt)
'GraphLabelFont' = ("Monotype Sans WT J",12pt)
'GraphDataFont' = ("Monotype Sans WT J",12pt)
'GraphTitleFont' = ("Monotype Sans WT J",12pt)
'GraphFootnoteFont'=("Monotype Sans WT J",12pt)
'GraphAnnoFont'=("Monotype Sans WT J",12pt);
end;
run;
proc format;
value agefmt
20-30 = "20 (*ESC*){unicode '207b'x}(*ESC*){unicode '00b2'x}"
30-40 = "30 (*ESC*){unicode '2264'x} 40"
40-50 = "40 (*ESC*){unicode '2264'x} 50"
50-60 = "50 (*ESC*){unicode '2264'x} 60"
60-70 = "60 (*ESC*){unicode '2264'x} 70"
;
run;
proc sort data=sashelp.heart out=heart;
by ageatstart;
run;
ods html style=unifonts;
proc sgplot data=heart ;
Title1 "Cholesterol Level by Age Range";
vbox cholesterol / category=AgeAtStart group=AgeAtStart ;
format ageatstart agefmt.;
run;
THANK YOU THANK YOU THANK YOU for this 😀
Thanks for a very useful post! Interestingly, I found that the ODS escapechar doesn't work here, you must use (*ESC*).
I also found that the spefication used here works for formats but not for labels.
proc format;
    value $sexF
        'F'="(*ESC*){unicode '2640'x}"
        'M'="(*ESC*){unicode '2642'x}"
    ;
run;

title "The unicode specification doesn't work in a label (*ESC*){unicode 2639}";
proc sgplot data=sashelp.class;
    format sex $sexF.;
    label height="(*ESC*){unicode '263A'x} height";
    vbox height / category=sex;
run;
The label for "height" isn't expanded. Is there a workaround?
I'm using SAS 9.4M3 (9.04.01M3P06242015)
(*ESC*) is not supported on the LABEL statement.
You can specify the label on the YAXIS statement: yaxis label ="(*ESC*){unicode '263A'x} height";
proc sgplot data=sashelp.class;
format sex $sexF.;
yaxis label ="(*ESC*){unicode '263A'x} height";
vbox height / category=sex;
run;
Nice to know, and nice graphs.
But IMHO it is a bad idea to define ranges in a format such that the end value is included.
The label "20 ≤ 30" suggests that the value 20 is included, while in fact it belongs to the range "10 ≤ 20".
I realize that defining the range in Proc Format as 10 -< 20 (which I see as best practice) would remove the whole reason for trying to include the ≤ symbol in the graph, but it should be easy to think of another example.
Good point Frank. I'll be sure to modify the code before I publish this in our sample library.