Do you support a multilingual reporting audience? This is a fast-growing requirement for many of you, and now your SAS Visual Analytics reports can be easily configured to support any number of languages.
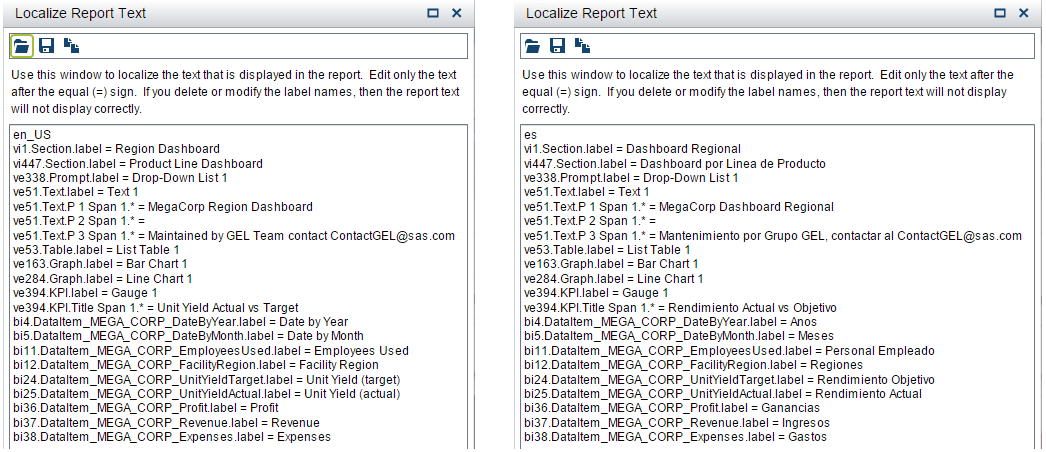
From SAS Visual Analytics Designer, there is an option under the File menu called Localize Report. This brings up the Localize Report Text dialogue. This dialogue lists all of the available items and their values that can be translated into a different language. Keep in mind that you cannot translate the data surfaced in the report, but you are able to translate almost all text that appears in the report, such as object labels, tooltips and other descriptive text.
Working with your browser locale setting
Notice the first line in the Localize Report Text dialogue from the screenshot below: en_US. This represents the ISO 693 two-letter language code and two-letter country code used by browsers to identify which language is to be used for this report. Therefore, because my browser’s locale is set to en_US or English (US), SAS Visual Analytics will look to see if this locale is available for this report, and if it is, it will use that locale’s descriptive text. If it does not exist, it will default to the next best locale possible. For example, if someone in Great Britain uses a browser locale of en_GB, they will receive the en_US because no other version of English has been provided.

A SAS authored technical paper, One Report, Many Languages: Using SAS Visual Analytics 7.1 to Localize Your Reports is available and covers additional locale explanations, further text examples and advanced features in more detail. Part of that document outlines some text that cannot be translated. These include but are not limited to:
- Name of the report
- Reference lines on a graph object
- Text in an exported Visual Analytics Explorer object
- Currency format, based on original report data source locale
- Sorting order, based on original report data source locale
- Rich text with elaborate style changes or line breaks
- Custom group data values
Adding more languages for your report
This is how you build additional language support for your SAS Visual Analytics reports: you add translated copies of the localize report text with different ISO 693 two-letter language code and two-letter country codes to support the languages you need. Let’s look at the steps in more detail:
- Create and save your report.
- With your report open, select File then Localize Report… for the Localize Report Text dialogue to open. Then use the Save button to save the text to your computer. Be sure to give it a meaningful name that includes the original report language or locale abbreviation.
- On your computer, copy the original report text file and give it a new name that includes the new language or locale abbreviation.
- On your computer, use a text editor to open the new language report text file. Enter the ISO 693 two-letter language code and two-letter country code as the first line. Translate the available text that matches the new locale. Note: All report text is encoded as Unicode characters using the UTF-8 format, be sure the text editor is capable of saving the data as UTF-8.
- Back in SAS Visual Analytics Designer, open the original report. Select File then Localize Report… for the Localize Report Text dialogue to open. Use the folder open icon to import the new language report text. Click Apply to save the new language report text to the report’s definition. Note: Your report is immediately updated and saved. You cannot revert to a previous version of localized text or undo your changes, so be sure to manually indicate the version of your translations on your computer or shared location so that you can revert back to an older version if necessary.
- One way to test your new report language is to change your browser locale to the target report language you would like to view. In Mozilla Firefox, open the Options menu, then on the Content tab under Languages select Choose…. Add the language you wish to test and move it to the top of the list. Then open the report you wish to test, and you will see the report open in the language the browser locale is set to.
- Repeat the process for additional languages. NOTE: It is recommended to always add localizations to the original report locale.
Here is an example of translating a SAS Visual Analytics report into Spanish. The graphic below shows the language codes en_US and es as the first line in their respective Localize Report Text windows. As you compare label names in subsequent lines, you’ll see examples of items where text is translated.
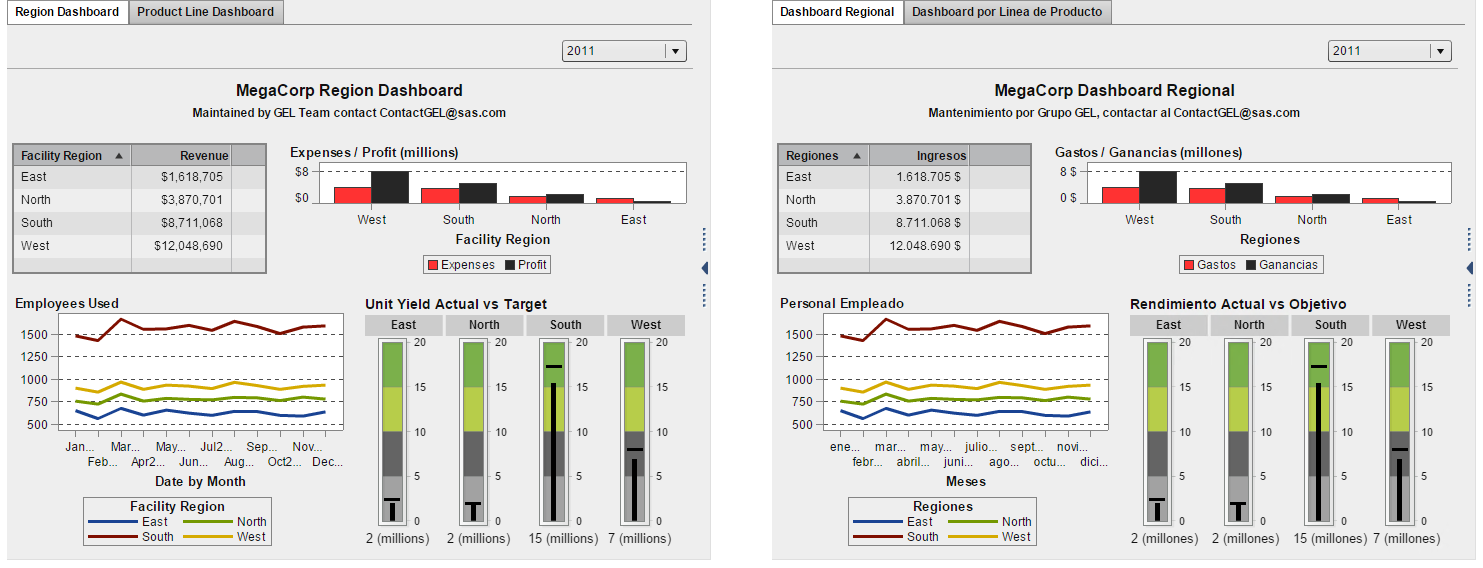
The graphics below show the resulting localized SAS Visual Analytics report. Remember this is the same report, but the browser locale is set to different language preferences with the US English preference on the left and the Spanish language preference on the right.
Maintaining localizations
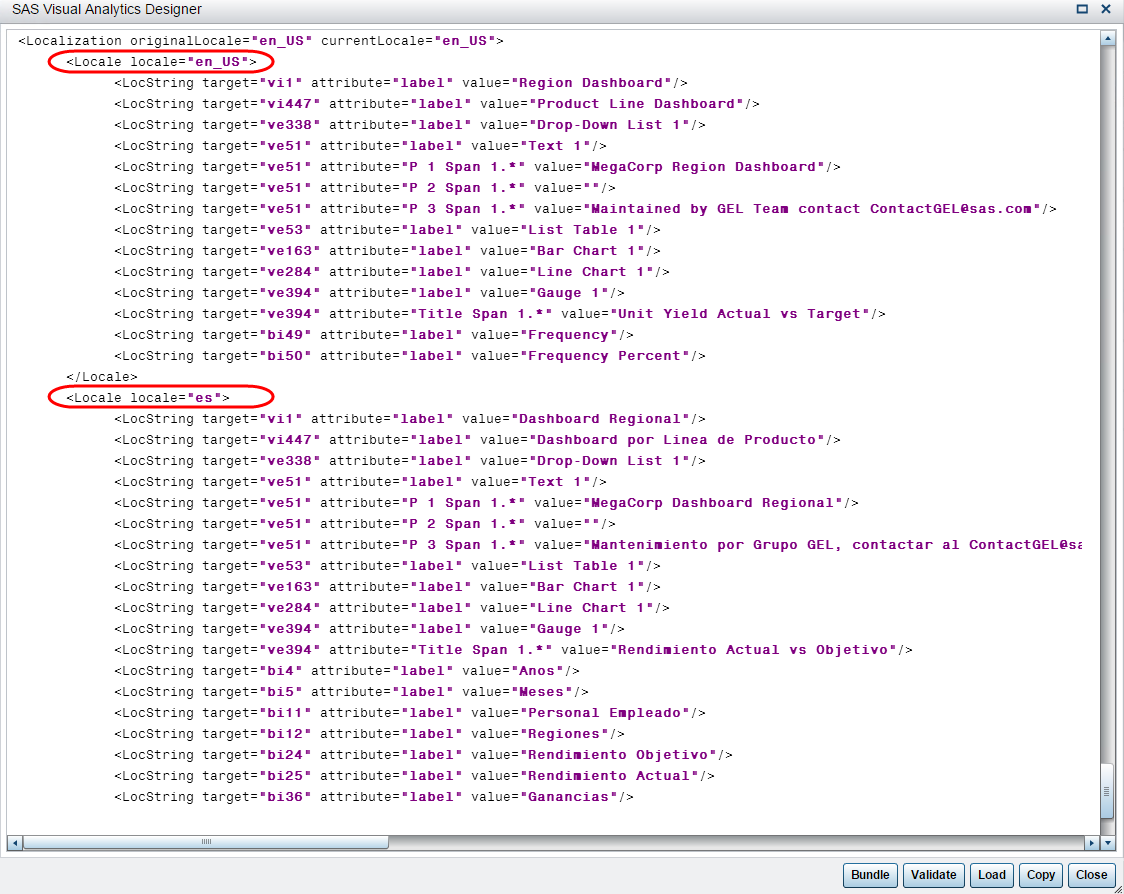
As for maintaining your localizations, you cannot see a list of localizations for a report. There is, however, an unsupported and undocumented way to view the report’s Business Intelligence Report Definition XML (BIRD XML), so that you can determine what localizations have been added to a report. From SAS Visual Analytics Designer, open the report in Edit mode and ensure the body of the report is the active window by clicking inside a report object. Then click Ctrl + Alt + b to bring up the reports’ BIRD XML. Scroll to the bottom and you will see the <Localization> and <Locale> tags that will indicate what locales have been added to the report.
How many languages do you need for your organization's reports? Please let me know if you have any tips or tricks for producing SAS reports in an international setting.
