The sun has gone eerily quiet, in the middle of what should be the height of the 11-year sunspot cycle...
Here's a superb photo of some sunspots that Stephen A. Carr posted to the Telescope Addicts Facebook group - a group which I follow with great interest. (Thanks for allowing me to use the photo Stephen!)
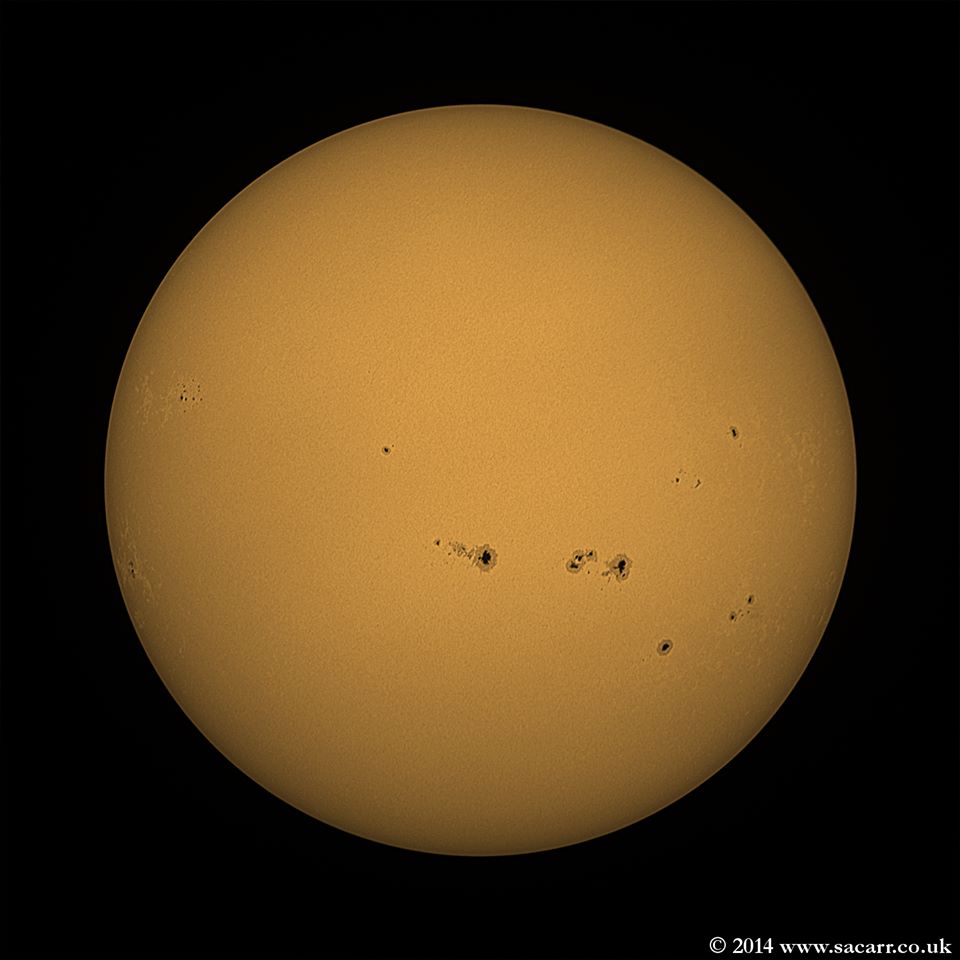
But Stephen would not have been able to take such a picture yesterday ... A physics.org article pointed out that NASA's Solar Dynamics Observatory had just recorded an All Quiet Event (no sunspot activity). And being in the middle of what should be the height of the 11-year sunspot cycle (ie, the solar maximum), that does seem a bit odd. It also seems like something I could see better with some SAS graphs!
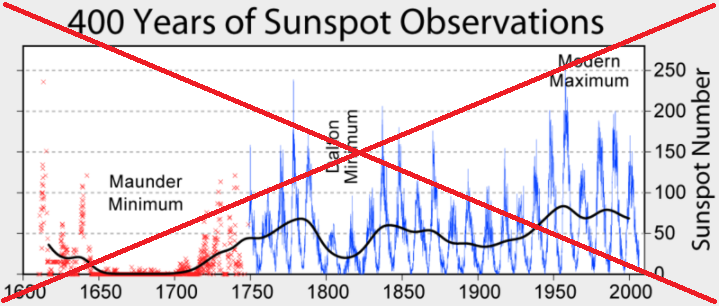
When it comes to visualizing the 11-year sunspot cycle, the graph shown on Wikipedia is probably the most famous. But the data in that graph only goes a few years past year 2000 (up through the previous 11-year cycle's minimum). I wanted to see the current maximum, in context of all the other data on the graph.
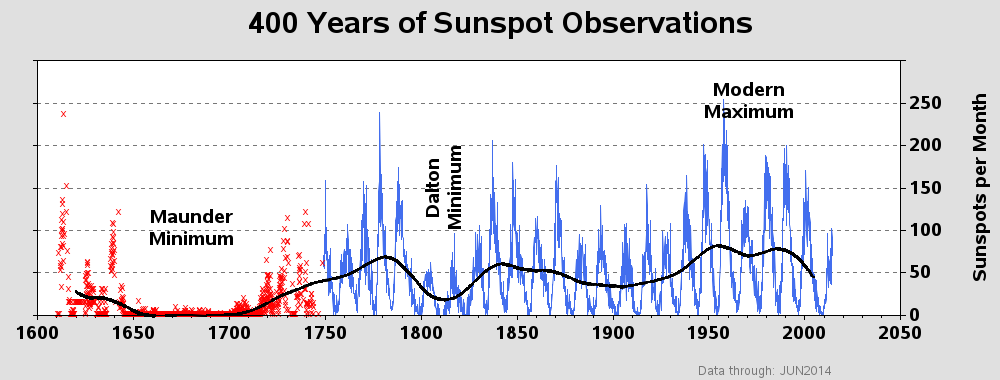
I located a source for the monthly mean sunspot numbers, and set up some SAS code to import them directly from the Web. I then transposes it so that the monthly columns became one long series that I could plot across a time axis (red and blue portions of graph). I used Proc Expand to calculate the moving average and overlaid it on the same plot (black line). And with the addition of a few annotated labels, I now have a graph almost exactly like the original, but also including the latest/greatest monthly sunspot numbers :)
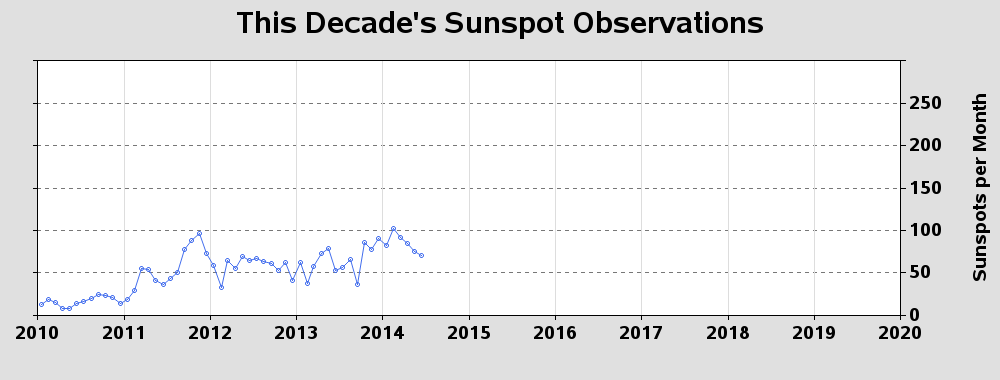
Plotting this much data on 1 screen makes it a little difficult to see exactly what the most recent cycle is doing. Therefore I created an additional plot, just showing the most recent ~11-year cycle (plotted against the same y-axis scale). It does indeed show a very wimpy number of sunspots, and also seems to indicate that we have perhaps crossed the peak of the cycle, and are on our way back down.
So, are any of my blog readers astronomers? What are your theories or observations on sunspots and solar cycles?

2 Comments
The sunspot number has been calculated using at least two different equations. Observations are missing in many places. Different observers, using different methods and different instruments have contributed results over many years. Volcanic eruptions, have on occasion, made it almost impossible to observe the Sun directly and, as far as I know in 1816, after Tambora's eruption a huge sunspot was visible through the volcanic dust cloud. Plagues, revolutions, wars etc., have all affected the people making the observations. NASA is now trying to sort everything out.
Interesting factors to think about! (As they say, "the devil is in the details"!)