My colleague Rick Wicklin maintains a nifty chart that shows the timeline of SAS releases since Version 8. A few of you asked if I could post a similar chart for SAS Enterprise Guide. Here it is. Like Rick, I used new features in SAS 9.4 to produce this chart (in fact, I cribbed heavily from his code)...but I used SAS Enterprise Guide to run the program.
Update 03Jul2025: I've updated the graph and code in this post for the most recent versions of SAS Enterprise Guide and SAS. I also gave the chart a branding facelift, reflecting the most recent SAS colors and fonts that we use.
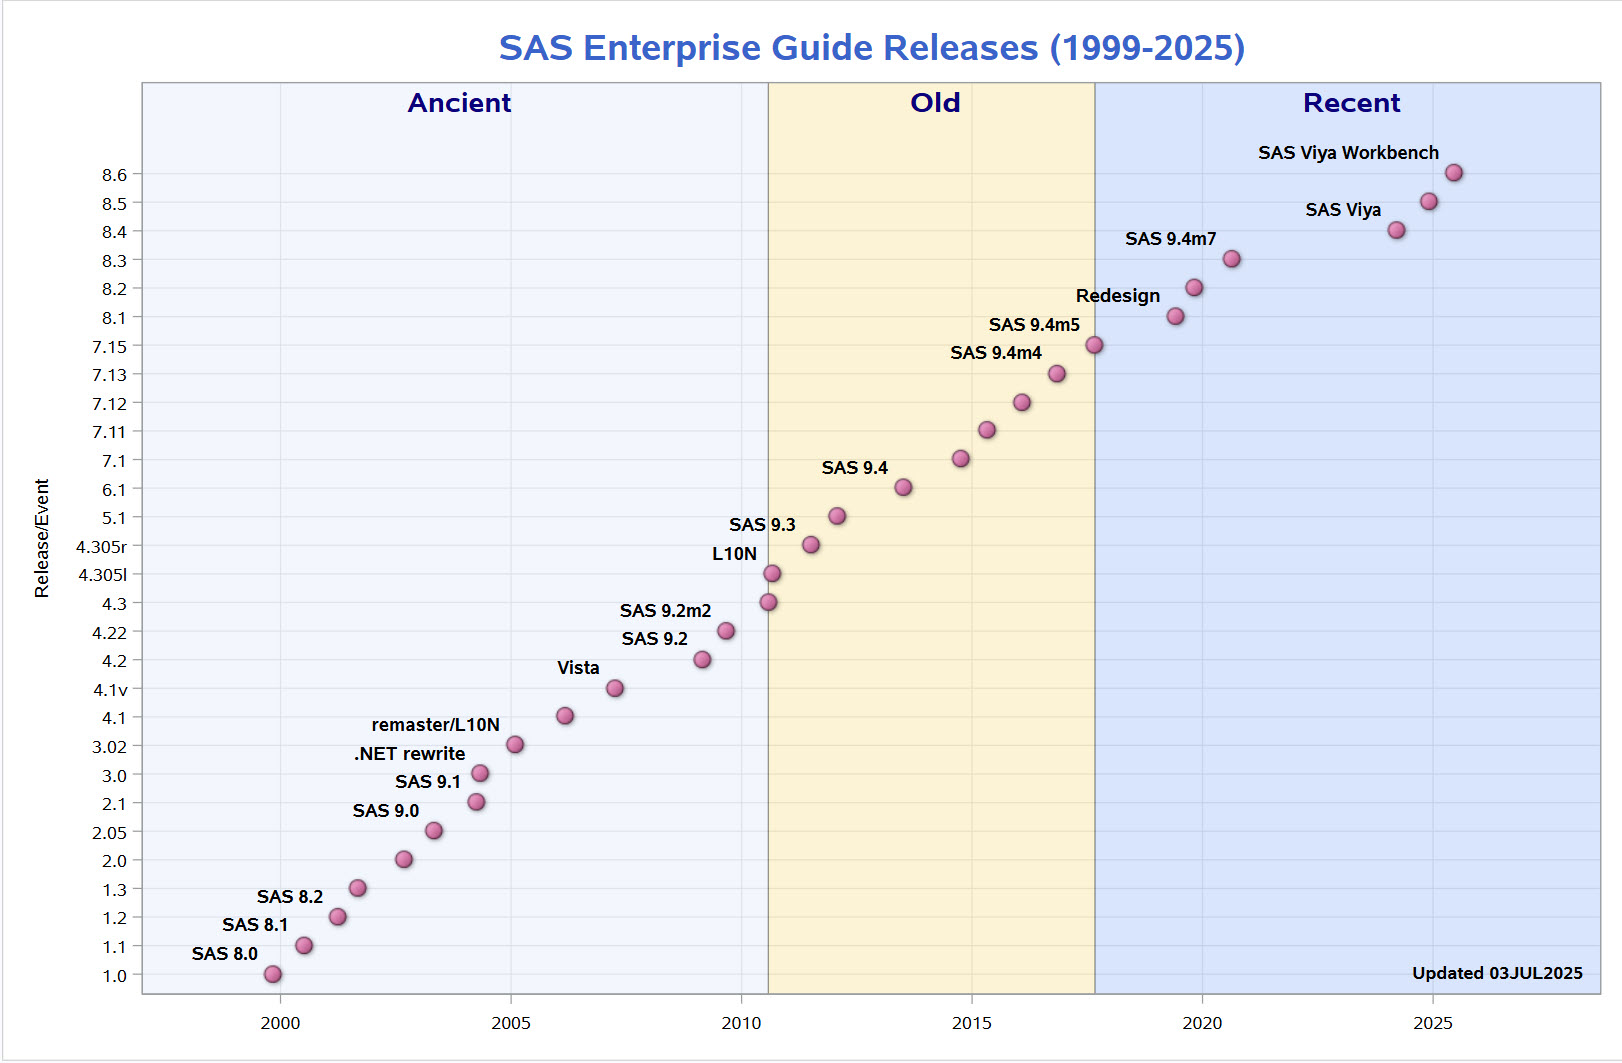
You might notice that my chart is a bit busier than Rick's version. As a desktop client application that works across multiple SAS versions, we tend to issue major releases of SAS Enterprise Guide more often than we update the core engine of SAS software.
On my chart, the labels on the data points indicate the "event" that motivated the release. In some cases, we issued a new release to go with a new version of SAS (such as v1.2 with SAS 8.2). In other cases, we "remastered" a version to support more languages or another operating system (such as Microsoft Vista support with v4.1 in 2007, or the L10N release of v4.3 in 2010). Most recently, we released a version of SAS Enterprise Guide that can connect to SAS Viya 4 and then SAS Viya Workbench.
You might also notice that some of these releases happened very close together. Often, SAS R&D works on updates to multiple releases in parallel. Developers make changes to multiple versions to provide maintenance and hotfix changes (based on customer needs), while still contributing to the Next Big Version that will contain the compelling new features (based on customer wishes).
Here's the code that produced the chart:
data Releases; format Date DATE7.; input Category $8. Release $7. Date DATE9. Details $20.; datalines; Ancient 1.0 01Nov1999 SAS 8.0 Ancient 1.1 01Jul2000 SAS 8.1 Ancient 1.2 01Apr2001 SAS 8.2 Ancient 1.3 01Sep2001 Ancient 2.0 01Sep2002 Ancient 2.05 01May2003 SAS 9.0 Ancient 2.1 01Apr2004 SAS 9.1 Ancient 3.0 01May2004 .NET rewrite Ancient 3.02 01Feb2005 remaster/L10N Ancient 4.1 01Mar2006 Ancient 4.1v 01Apr2007 Vista Ancient 4.2 01Mar2009 SAS 9.2 Ancient 4.22 01Sep2009 SAS 9.2m2 Old 4.3 01Aug2010 Old 4.305l 01Sep2010 L10N Old 4.305r 01Jul2011 SAS 9.3 Old 5.1 01Feb2012 Old 6.1 01Jul2013 SAS 9.4 Old 7.1 01Oct2014 Old 7.11 01May2015 Old 7.12 01Feb2016 Old 7.13 01Nov2016 SAS 9.4m4 Recent 7.15 01Sep2017 SAS 9.4m5 Recent 8.1 01Jun2019 Redesign Recent 8.2 01Nov2019 Recent 8.3 18Aug2020 SAS 9.4m7 Recent 8.4 19Mar2024 SAS Viya Recent 8.5 04Dec2024 Recent 8.6 19Jun2025 SAS Viya Workbench ; /* running in SAS EG - modify active ODS to add title to graph */ ods html5(id=eghtml) style=htmlencore gtitle; ods graphics / height=850 width=1300 ; title font="Anova" height=2.2 color=cx0766D1 "SAS Enterprise Guide Releases (1999-2025)"; proc sgplot data=Releases noautolegend; styleattrs datacolors=(cxC4DEFD cxFFCC33 cx4398F9); block x=date block=category / transparency = 0.75 valueattrs=(weight=bold size=14pt color=navy family='Anova'); scatter x=date y=release / datalabel=Details datalabelpos=topleft dataskin=matte datalabelattrs=(size=10pt weight=bold Family="Anova") markerattrs=(symbol=CircleFilled color=cxFF66B2 size=14); xaxis grid type=time offsetmax=0.1 offsetmin=0 valueattrs=(Family="Anova") ranges=('01Jan1997'd-'01Jul2025'd) display=(nolabel) ; yaxis type=discrete grid offsetmax=0.1 valueattrs=(Family="Anova") label="Release/Event" labelattrs=(Family="Anova"); inset "Updated &SYSDATE9." / textattrs=(weight=bold) position=bottomright; run; |

24 Comments
Great chart Chris! When you view the EG versions over time, you see how busy the R&D team has been. It's nice to see the SAS version and details as a datalabel. Presents the data very well.
This is great. I remember when I was learning SAS - I tried EG 2.1 and couldn't understand how to use it. But when version 4.1 came around - I was a convert!! Hard to believe that was 2 years difference.
Thanks for doing this!
v4.1 was when we changed to have a more process-flow-oriented project. Before that, the EG project was more of a treeview structure...which was limited because not everything can be represented hierarchically.
Hello Chris!
I tried to run this program changing the data to Enterprise Miner versions. It's not easy to find the dates, not at all... but I have another problem.
When I run your program I have a '1999' instead of a '2000' in the horizontal axis. I've tried several options with no success.
What could be happening?
I'm using Enterprise Guide 7.15 HF8 (7.100.5.6214) (64-bit) with Windows 10 Pro.
Thanks a lot.
Daniel, this might have to do with the data values you have, as SGPLOT tries to figure this out. You can use VALUES= and VALUESHINT on the XAXIS statement to influence this.
Thanks for updating this Chris; I'm using the data to lobby for our IT group to install 8.2. Fingers crossed!
Thanks Chris, After seeing this i updated 8.2.
Chris,
Can i update to 8.3 from 8.2 version of SAS EG using Check for Updates ? Right now it does not seem to be updating this way.
I'll have to check with the team, but it might not be available for autoupdate. EG 8.3 doesn't really add any features, but it does update to a newer version of the .NET framework as a baseline. Not sure if that can be delivered via Check for Updates.
What about an equivalent SAS Studio chart? And who will create it? Chris, Rick, or someone else? ;-)
Good question! Since the SAS Studio version is more tied to the version of SAS you are running, this probably would not be as complex as the EG chart.
Not me. I think changes in a GUI are less important than changes in the underlying capabilities of the software. I created the SAS chart for two reasons. First, new features/procedures/statements appear in each release. When you are talking to someone on the Support Communities, it is useful to be able to say that the feature they need is in version 9.x which was released in 20XX. Second, customers sometimes do not realize how old their version of SAS software is. Would you use a smartphone from 10 years ago? In comparison with today's models, a decade-old phone seems clunky and lacks features. The same is true for old versions of computer software.
As a SAS UK support consultant at the time, I remember having to visit a global bank that was experiencing random BSOD in EG 1.3 ( I think).
After extensive testing I eventually tracked the problem down to a defect in the sound card driver, triggered when the parrot said certain words.
That's how you know you're a REAL consultant, solving problems like that!
A colleague was telling me that an early version of EG had a "helper", a bit like the (in)famous Microsoft paperclip. What version was that? I don't have a clear memory of it.
It's true. We used the Microsoft Agent tech, similar to the "clippy" but ours was Merlin the wizard, Peedy parrot, or the Genie (all stock characters). It was in EG 1.0->1.3, but removed in v2.0. I was the developer who coded all of the interactions. And I was the one who "furloughed" the agent in v2.0.
This is really neat!
My work at the University of Arizona is funded by a grant that requires me to use EG 7.15 HF9 (7.100.5.6226) (64-bit) via a server hosted at the Instituto Nacional de Salud Pública in Morelos, Mexico. When was v7.15 released?
EG 7.15 was released in Sept 2017 -- so it's quite old! Even if you are using an older version of SAS 9.4, you can still use a newer version of EG. If it's possible to upgrade, I'd recommend it.
Hi Chris, thanks for writing this blog! I found it when researching a customer issue. Quick question/request: Where does 9.4M6 fit in exactly in this graph? It is not included currently. It looks like EG version could be 7.15 or 8.1 or 8.2 at 9.4M6, depending on the exact ship event. I think it would be helpful to include the 9.4M6 info too.
Hi Bishal, there was no EG "new version" at 9.4m6, which was in Nov 2019. So the latest EG version at that time was v7.15. Since this chart plots EG release events there's not a great way to add the SAS release to the chart...but you can reference Rick's SAS versions chart for the cross-reference!
Note that the chart doesn't reflect/limit the compatible combinations. EG is one of the SAS client applications that can work with multiple versions of SAS. In theory, the most recent version of EG (currently 8.6) could work with any SAS from the latest SAS Viya going back to SAS v9.2 -- but let's not test with a 16+ year-old version of SAS.
Thanks for the clarification, Chris. Unfortunately, we get questions like this from customers "I deployed 9.4M6. I did not get 8.2 version of EG. Why?" The answer is, "It depends on the ship event/revision number you deployed from". It would really help if we had something like this to point our EG customers to- https://sas.service-now.com/csm?id=kb_article_view&sysparm_article=KB0036238. This KB documents SAS Enterprise Miner, SAS Text Miner, and Credit Scoring Add-on for SAS Enterprise Miner release numbers. I will propose this to my EG Technical Support colleagues.
Bishal, all of the later versions of EG have a "check for updates" feature that should bring EG versions up to date even if an older EG comes with the software depot. However, SAS 9.4M6 is pretty old at this point and is outside of standard support, so we hope people are not deploying that.
Yeah, unfortunately, we still have a lot of customers yet to upgrade from limited support 9.4 releases. We get questions like this from such EG customers. This blog is a good reference for them, so thanks again for writing it!