Broadly speaking, the holy grail of digital media measurement is to analyze the impact and business value of all company-generated marketing interactions across the complex customer journey. In this blog post, my goal is to take a transparent approach in discussing how data-driven marketers can progress past rules-based attribution methods, and make the business case for leveraging algorithmic applications.
Let's begin with a video example that pokes humor at the common problems related to multi-channel marketing attribution. The business challenge is that everybody believes they should have more marketing budget because their tactics are supposedly responsible for driving sales revenue. The video suggests that challenges arise rapidly when supporting analysis to justify these claims isn't sound. While the video is fictional, the problems are very real. With that said, there are three main drivers to getting digital attribution analysis right:
- Allocating credit across marketing channels more accurately
- Providing invaluable insights to channel interactions
- Empowering marketers to spend more wisely in future media activity
Have you ever given thought to the many ways that a customer can find your brand's digital properties? Organic results on a search engine, display media campaigns, social media links, re-targeting on external sites, and the list goes on in today's fragmented digital ecosystem. One thing is for certain - consumer digital journeys are far from linear. They can occur across multiple platforms, devices and sessions, and organizations are challenged with gaining an accurate understanding of how:
- External referral clicks (or hits) are mapped to channels and visits
- Visits are mapped to anonymous visitors
- Anonymous multi-channel visitor journeys are mapped to identifiable individuals across different browsers and devices
With careful consideration towards the areas of data management, data integration, and data quality, analyzing customer-centric (or visitor-centric) channel activity on their journeys to making a purchase with your brand can have immense benefits. Ultimately, marketers desire to apply a percentage value that can be attached to each channel's contribution to the purchasing event (or revenue). This is critical, as it allows the organization to determine how important each channel was in the customer journey, and subsequently, influence how future media spend should be allocated.
Sounds fairly easy, right? Well, as Avinash Kaushik (digital analytics thought leader at Google) stated in his influential blog post on multi-channel attribution modeling:
"There are few things more complicated in analytics
(all analytics, big data and huge data!)
than multi-channel attribution modeling."
The question is...why is it challenging? Avinash's blog post was written in the summer of 2013, and I strongly believe 2.5 years later we are living in a game-changing moment within digital analytics. Marketers are being enabled by technology companies with approachable and self-service analytic capabilities, and this trend directly impacts our ability to improve our approaches to problems like attribution analysis. However, rules-based methods of attribution channel weighting continue to be far more popular in the industry to date, which contradicts the recent analytic approachability trend. Before we dive into algorithmic attribution, let's review the family of approaches commonly applied in rules-based attribution:
Last Touch & First Touch Attribution
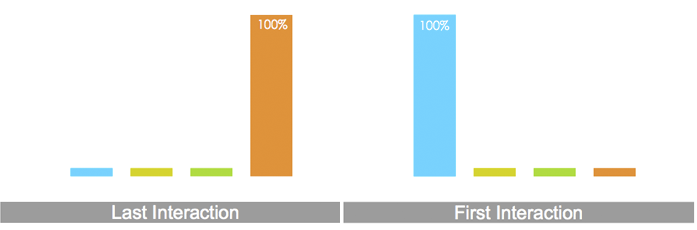 Allocates 100% of the credit to either the last or first touch of the customer journey. This approach has genuine weaknesses, and ignores all other interactions with your brand across a multi-touch journey. It is stunning, in my opinion, that web/digital analytic technologies have traditionally defaulted to this approach in enabling their users to perform attribution analysis. The reason for this was last/first touch attribution was easy, and could claim ownership of the converting visit (although that is only partially true). Thankfully, times are changing for the better, and this rudimentary approach has proven ineffective, guiding marketers (for the sake of job security) to try more intelligent methods.
 Linear Attribution
Arbitrarily allocates an equal credit weighting to every interaction along the customer journey. Although slightly better than the last and first touch approaches, linear attribution will under-credit and over-credit specific interactions. In a nutshell, it over-simplifies the complex customer journey with your brand.
.
Time Decay & Position Based Attribution
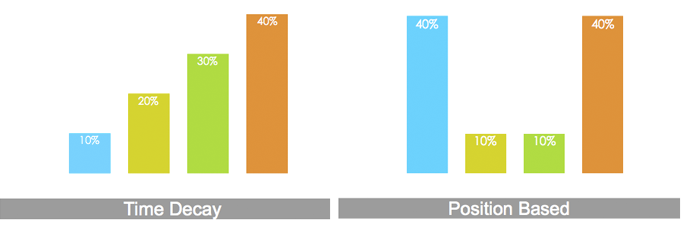 Time decay attribution arbitrarily biases the channel weighting based on the recency of the channel touches across the customer journey. If you are bought into the concept of recency within RFM analysis, there is some merit to approach, but only when comparing with other rules-based methods. Position based attribution is another example of arbitrary biasing, but this time we place higher weights on the first and last touches, and provide less value to the interactions in-between. As Gary Angel (partner & principal of the digital analytics center of excellence at Ernst & Young) stated in his recent blog posting:
"There’s really no reason to believe that any single weighting system somehow captures accurately the right credit for any given sequence of campaigns and there’s every reason to think that the credit should vary depending on the order, time and nature of the individual campaigns."
Although there are some other minor variants to the rules-based method approaches, highlighted above are the majority of approaches that the digital marketing industry commonly uses. As a principal solutions architect at SAS, I have the opportunity to meet with clients across multiple industries to discuss and assist in solving their marketing challenges. When it comes to attribution, here is a summary of what I have seen clients doing in 2015:
Buying Web/Digital Analytics Software That Includes Rules-Based Attribution Measurement
This is typically when an organization invests in a premium (or more expensive) software package from their web/digital analytics technology partner, which includes out-of-the-box attribution capabilities. Here is a video example discussing how one of the most popular web analytic platforms in the world includes capabilities for various methods of rules-based attribution.
Two takeaways from this video that I love are:
 Comparing the attribution problem to soccer (or futbol), and accepting that we cannot give 100% credit to the goal scorer. There is a build up of passes to set up the goal (i.e. purchase), and each of these events (i.e. marketing channel touches) contribute value. Even though names like Messi, Ronaldo, and Neymar are commonly known in soccer, ignoring names like Iniesta, James Rodríguez, or Schweinsteiger would be a travesty.
.- Focus on the journey, and performing visitor-centric analysis as compared to visit-centric analysis

The difficulty I possess with the video is leveraging the term "data-driven attribution" when rules-based methods are the only approaches highlighted. In my opinion, we are only grazing the surface of what is possible. Algorithmic attribution, on the other hand, assigns data-driven conversion credit across all touch points preceding the conversion, using data science to dictate where credit is due. It begins at the event level and analyzes both converting and non-converting paths across all channels. Most importantly, it allows the data to point out the hidden correlations and insights within marketing efforts.
Have you ever wondered why web/digital analytic software doesn't include data mining and predictive analytic capabilities? It has to do with how digital data is collected, aggregated, and prepared for the downstream analysis use case. 
Web/digital analytics has always had a BIG data challenge to cope with since it's inception in the mid 1990's, and when the use case for users is to run historical summary reports and visual dashboards, clickstream data is collected and normalized in a structured format as shown in the schematic to the right.
This format does a very nice job of organizing clickstream data in such a way that we go from big data to small, relevant data for reporting. However, this approach has limited analytical value when it comes to attribution analysis, and digital marketers are only offered rules-based methods and capabilities.
Data mining and predictive analytics for algorithmic attribution require a different digital data collection methodology that summarizes clickstream data to look like this:

Ultimately, the data is collected and prepared to summarize all click activity across a customer's digital journey in one table row. The data table view shifts from being tall and thin, to short and wide. The more attributes or predictors an analyst adds, the wider the table gets. This concept is referred to as preparing data for the analytic base table (or input modeling table). This is the best practice for advanced algorithms to be used to fit the data. Shhhhhhhh! We'll keep that insightful secret between us.
More importantly, don't let this intimidate you if you're new to these concepts. It boils down to the ability to reshape granular, HIT-level digital data for the best practices associated with data mining. Can it be done? Absolutely, and algorithmic digital attribution is a prime example of big data analytics for modern marketing. The question I challenge my clients with is to consider the arbitrary (or subjective) nature of rules-based methods, and associated limitations. Although they are easy to apply and understand, how do you know you aren't leaving opportunity on the table? This leads me to the next recent trend of what I observe clients doing.
Buying Algorithmic Attribution Consultative Services
The best way to kick this section off is to share how 3rd party marketing attribution vendors introduce themselves. Here are two video examples to consider:
How do you feel after watching these videos? If you are raising your hands to the sky thanking the higher forces of the marketing universe, I completely understand. Many of my clients describe their marketing organization's culture as unprepared for algorithmic attribution, ranging from lack of subject-matter expertise, big data hurdles, or employee analytical skills. There can be tremendous value in selecting an external partner to handle analysis and actionability, and accelerate your ability to make better digital media investment decisions. 3rd party attribution vendors have the domain knowledge, technology, and a track record, right?
In addition, this segment of my clientbase seem less concerned with transparently understanding how to analytically arrive to their decision strategy, as long as the financial results of their attribution vendor's services look good compared to baseline KPIs. Although these vendors will never reveal their analytical secret sauce (i.e. intellectual property), digital marketing is an overwhelming ecosystem, and who has the time to discuss analytical model diagnostics, misclassification rates, ROC plots, lift curves, and that silly confusion matrix...
That's one trend I see. The other trend is when a marketing organization is analytically mature, and this leads me to the next section.
Building Algorithmic Attribution Models In-House
Do you want to perform algorithmic attribution analysis yourself and maintain a transparent (white-box) understanding of how your analytic approaches are influencing your digital media strategies? If you answered yes, I believe the best way to take you on this journey is through a case study. I'm a strong advocate of this approach, and believe this is a cutting edge application of marketing analytics:
Case Study: Hospitality Industry
The Challenge:
Unable to scale digital analytics for algorithmic attribution to measure drivers of conversion and advertising effectiveness.
Business needs to understand:
- Drivers of resort hotel bookings online,
- Marketing channel attribution to bookings with statistical validation,
- Insights to allocate future digital media ad spend.
Current Limitations:
- Clickstream and display ad-serving data very large in size,
- Rules-based attribution methods largely inaccurate.
Technical Summary:
- 90 day est. file size for extracted Adobe HIT data: 3.0 TB,
- 90 day est. file size for extracted Google DoubleClick (display media) data: 4.0 TB,
- Analytical data prep, modeling, and scoring workflow must be capable of processing on Hadoop platform (i.e. big data lake).
Digital Data Preparation Summary:
In this exercise, the hospitality brand was extracting raw data from their relationships with these digital marketing technologies into an internal Hadoop data landing zone. Their goal is to start stitching various digital marketing data sources together to gain a more complete view of how consumers interact with their brand. Analytically speaking, this is very exciting because we can gain a better understanding of the value of channel touches, onsite click activity, media impressions, viewability, creative content, ad formats, and other factors that we do not have comprehensive visibility into with traditional web/digital analytics.
One valuable insight I would like to share is if you have never worked with raw clickstream data or display media data before, it would be advantageous to obtain a data dictionary and channel processing documentation from your digital marketing solution vendor(s). For example, every website that has installed web analytic tracking has an array of unique goals, interactions, segments, and other attributes that were configured for that specific business model. Analysts will not understand what eVar 47 is without a translation document. Guess what? eVar 47 is going to have a completely different definition from Brand #1 to Brand #2 to Brand #3. Sorry - there is no easy button for this.
Your analysts will thank you sincerely for taking these steps, and it will improve their ability to succeed. Since this is a SAS Blog, I imagine many of you will want to understand how we worked with the raw digital data in this case study.
1. Data access: SAS Data Loader for Hadoop
2. Visual data exploration to assess data quality issues: SAS Visual Analytics
3. Reshaping the data for analytic modeling (i.e. recoding, transformations, joins, summarization, transpositions): SAS Enterprise Guide
Analytic Model Results:
Now we move on to the fun and sexy step of the process...
Our methodology of approach was to address the digital attribution challenge as a predictive modeling problem. While I can’t go into the details here, I can share some of the analytical results.
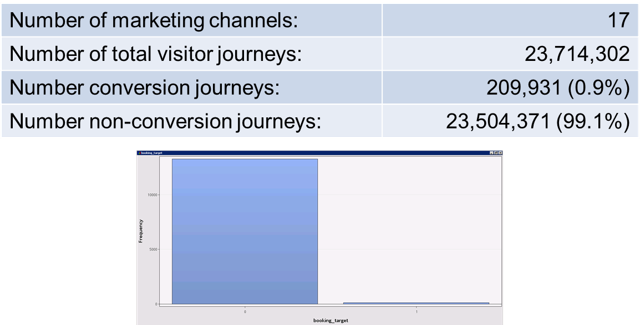
This analysis included 17 marketing channels, over 1,000 predictors, ~24,000,000 digital visitor journeys, and a rare conversion event occurrence of less than 1%. Oh my!
Now let me ask you a question - do you believe there is one piece of math that will solve all of our attribution challenges?
Absolutely not. The game of digital media investment is all about precision, precision, PRECISION! To maximize precision, in the field of data mining, we employ the use of champion-challenger modeling. Simply put, we throw a bunch of math at the data, and the algorithm that does the best job of fitting the data (i.e. minimizing error) is selected.
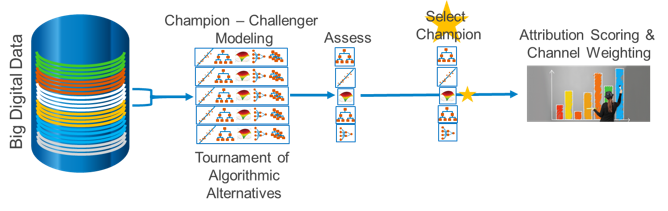
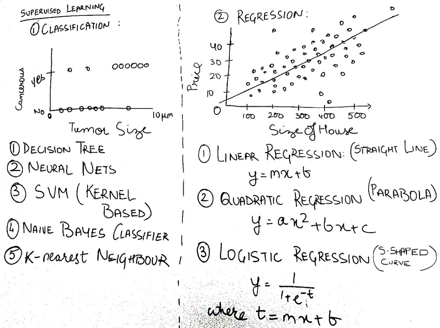
Scaling to large digital data with champion-challenger modeling is not trivial, but through the modernization of analytical processing in recent years, the time has arrived to dream bigger. Random forests, neural networks, regressions, decision trees, support vector machines, and more are all fair game, which means we can produce accurate assessments of marketing channel importance using the power of advanced analytics. Here is a snapshot of our modeling results within this project:
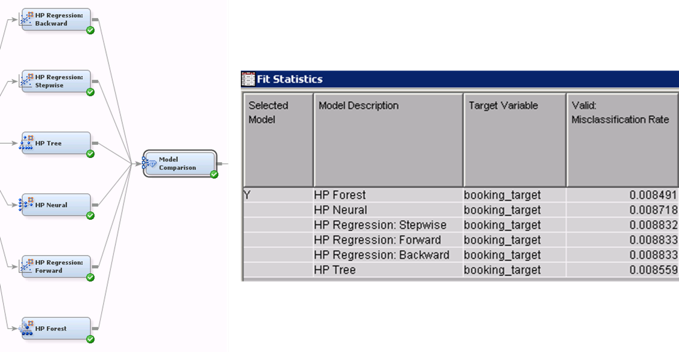
For those of you unfamiliar with misclassification rates, it's nothing more than a metric to summarize how many mistakes our analytical model is making. The lower the value, the better, and in this exercise, the random forest algorithm did the best job in analyzing and fitting our attribution data. There's your champion!
Next, let's share a lift chart visualization to help us get our heads around what we've accomplished here:
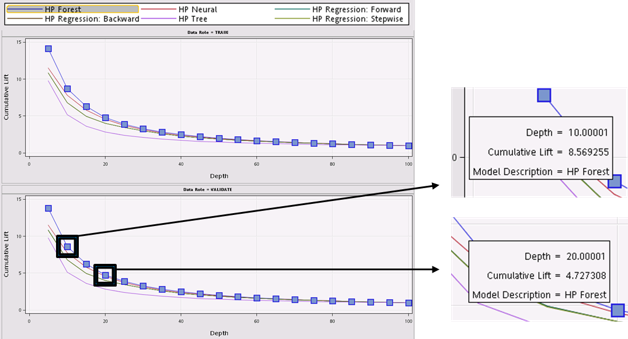
The beautiful takeaway in this example is we have identified an attractive segment (top decile with highest probability scores) that is 8.5 times more likely to convert as compared to randomly targeting the entire marketable population. Secondly, if we alter that segment view to the top two deciles, they are 4.7 times more likely to convert.
BOOM! This is awesome because we can now profile these segments, and proactively hunt for look-a-likes. In addition, be imaginative in how you might use these segments in other forms of digital marketing activities. For example, A/B testing in web personalization efforts.
But what about the marketing channels themselves? Which ones ended up being more (or less) important)? Well, here is a great visualization for channel weighting interpretation:
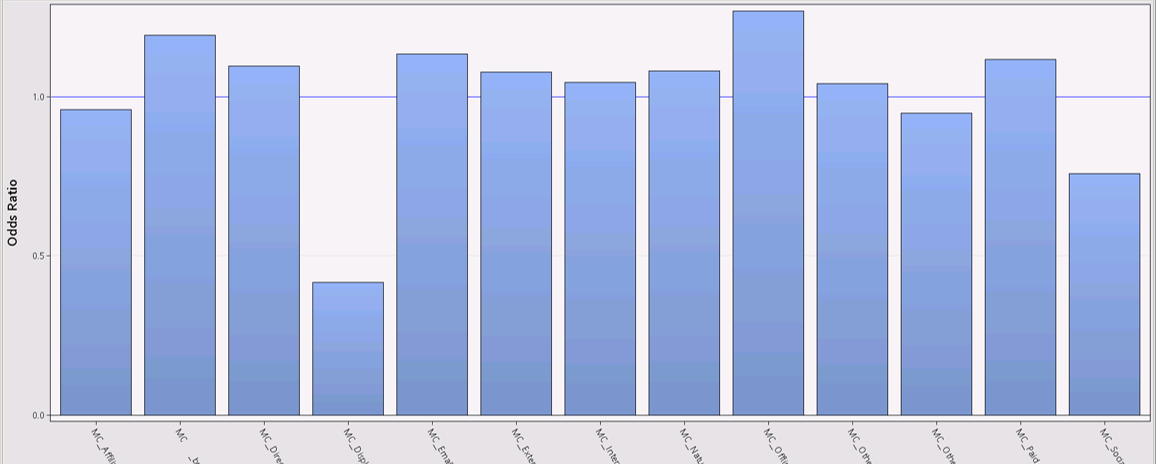
The odds ratio plot clearly highlights these insights in a non-technical manner. Channels above the horizontal line have a positive impact in increasing the probability of a visitor conversion, and channels below the line have a negative impact. For those of you who are unfamiliar with odds ratio plots, they serve as an ingredient to feed into a marketing dashboard that can explain market channel attribution performance.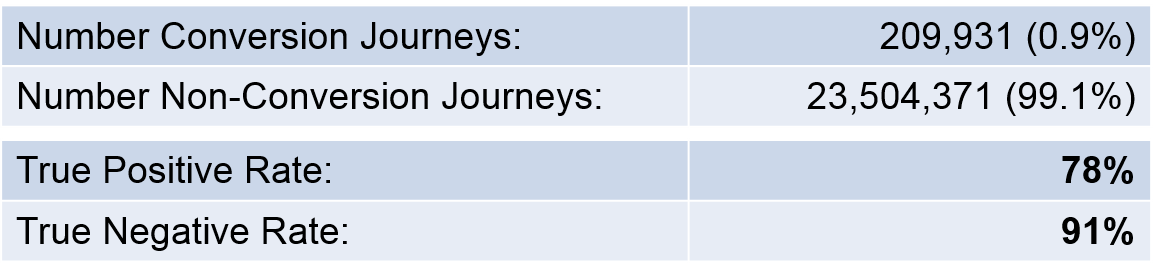
So how accurate were we? Was this model any good?
True positive rate simply means how accurate was our ability to correctly predict conversions. True negative rate summarizes our ability to accurately predict non-conversions. Given that our original event of conversion behavior was below 1% across a three month time window, our ability to predict conversions based on the modeling insights is a MASSIVE improvement (86.67 times more accurate) versus the mass marketing approach (or pure random targeting). Even though there is still room for improvement, these are very promising results.
To deploy or activate on these insights, this will vary based on your organization's approach to taking action. It may be the scoring of an internal database, or it might be passing the model score code to your digital data management platform to improve their ability to deliver media more intelligently. There are a number of use cases for marketing activation, but by doing this analysis in-house, you will have flexibility to conform to a variety of downstream process options.
Again, I suspect many of you will want to understand how we analytically modeled the digital data in this case study.
- Algorithmic modeling: SAS Enterprise Miner (High Performance Data Mining)
- Analytic scoring: SAS Scoring Accelerator for Hadoop
- Marketing channel performance dashboarding: SAS Visual Analytics
Why Aren’t More Organizations Doing This?
From my experiences in 2015, I believe there are three reasons:
- Large data volumes require the use of modern big data platforms
- The talent required to unlock the marketing value in that data is scarce, but the climate is improving - if you're searching for talent, please consider the future analysts, data miners, and data scientists we are training at the GWU MSBA program in Washington DC
- Organizations are rethinking how they collect, analyze, and take action on important digital data sources
If you made it this far in the blog posting, I applaud your commitment, desire, and time sacrifice to go on this written journey with me. We discussed the current landscape of digital marketing attribution, from methods of approach to providing a real case study in support of making the justification for algorithmic attribution (i.e. it's not a mythical creature from another universe). Digital data mining is on the rise, becoming more approachable, and will provide organizations competitive advantage within their industries for years to come.
Marketing analytics matter!
Let me know what you think in the comments section below. Lastly, if you would like to connect on social media, link with me on Twitter or LinkedIn.

1 Comment
Pingback: The analytics of customer intelligence, and why it matters