A popular way to use lists in the SAS/IML language is to pack together several related matrices into a single data structure that can be passed to a function. Imagine that you have written an algorithm that requires a dozen different parameters. Historically, you would have to pass those parameters
Tag: Statistical Programming
SAS/IML 14.3 (SAS 9.4M5) introduced a new syntax for creating lists and for assigning and extracting item in a list. Lists (introduced in SAS/IML 14.2) are data structures that are convenient for holding heterogeneous data. A single list can hold character matrices, numeric matrices, scalar values, and other lists, as
Last week I wrote about the 10 most popular articles from The DO Loop in 2017. My most popular articles tend to be about elementary statistics or SAS programming tips. Less popular are the articles about advanced statistical and programming techniques. However, these technical articles fill an important niche. Not
When you run an optimization, it is often not clear how to provide the optimization algorithm with an initial guess for the parameters. A good guess converges quickly to the optimal solution whereas a bad guess might diverge or require many iterations to converge. Many people use a default value
A statistical programmer read my article about the beta-binomial distribution and wanted to know how to compute the cumulative distribution (CDF) and the quantile function for this distribution. In general, if you know the PDF for a discrete distribution, you can also compute the CDF and quantile functions. This article
Did you know that a SAS/IML function can recover from a run-time error? You can specify how to handle run-time errors by using a programming technique that is similar to the modern "try-catch" technique, although the SAS/IML technique is an older implementation. Preventing errors versus handling errors In general, SAS/IML
Debugging is the bane of every programmer. SAS supports a DATA step debugger, but that debugger can't be used for debugging SAS/IML programs. In lieu of a formal debugger, many SAS/IML programmers resort to inserting multiple PRINT statements into a function definition. However, there is an easier way to query
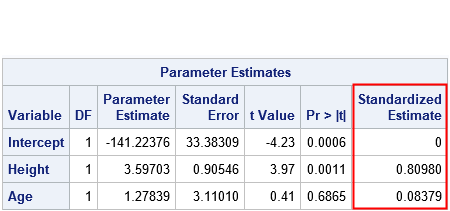
A common question on discussion forums is how to compute a principal component regression in SAS. One reason people give for wanting to run a principal component regression is that the explanatory variables in the model are highly correlated which each other, a condition known as multicollinearity. Although principal component
Toe bone connected to the foot bone, Foot bone connected to the leg bone, Leg bone connected to the knee bone,... — American Spiritual, "Dem Bones" Last week I read an interesting article on Robert Kosara's data visualization blog. Kosara connected the geographic centers of the US zip codes in
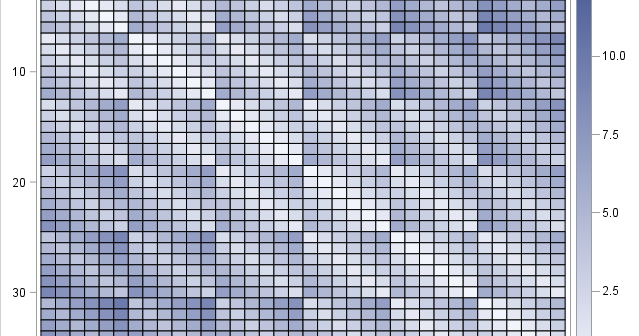
Visualizing the correlations between variables often provides insight into the relationships between variables. I've previously written about how to use a heat map to visualize a correlation matrix in SAS/IML, and Chris Hemedinger showed how to use Base SAS to visualize correlations between variables. Recently a SAS programmer asked how