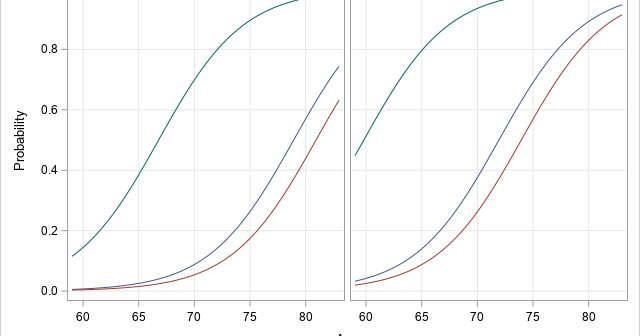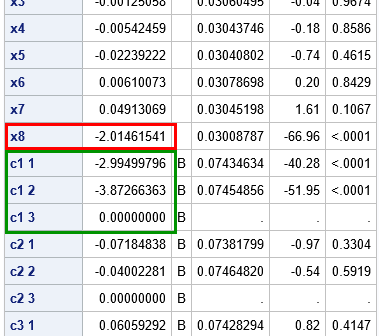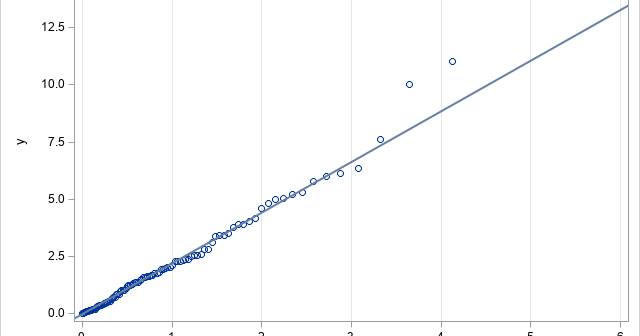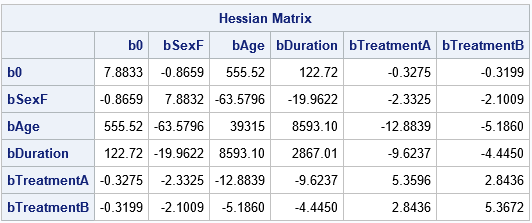
When you fit nonlinear fixed-effect or mixed models, it is difficult to guess the model parameters that fit the data. Yet, most nonlinear regression procedures (such as PROC NLIN and PROC NLMIXED in SAS) require that you provide a good guess! If your guess is not good, the fitting algorithm,
Tag: Statistical Programming
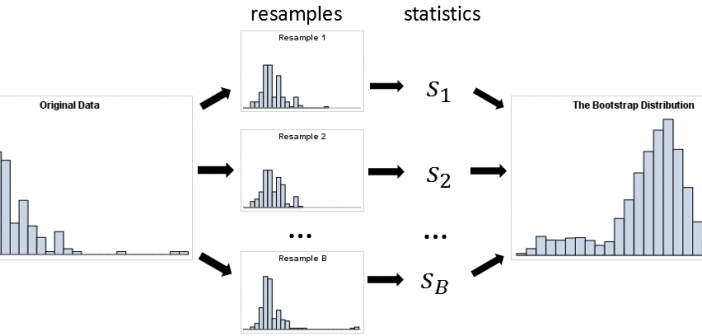
A previous article provides an example of using the BOOTSTRAP statement in PROC TTEST to compute bootstrap estimates of statistics in a two-sample t test. The BOOTSTRAP statement is new in SAS/STAT 14.3 (SAS 9.4M5). However, you can perform the same bootstrap analysis in earlier releases of SAS by using
I recently recorded a short video about the new syntax for specifying and manipulating lists in SAS/IML 14.3. This is a video of my Super Demo at SAS Global Forum 2018. The new syntax supports dynamic arrays, associative arrays ("named lists"), and hierarchical data structures such as lists of lists.
A colleague and I recently discussed how to generate random permutations without encountering duplicates. Given a set of n items, there are n! permutations My colleague wants to generate k unique permutations at random from among the total of n!. Said differently, he wants to sample without replacement from the
Correlation is a statistic that measures how closely two variables are related to each other. The most popular definition of correlation is the Pearson product-moment correlation, which is a measurement of the linear relationship between two variables. Many textbooks stress the linear nature of the Pearson correlation and emphasize that
Suppose you want to find observations in multivariate data that are closest to a numerical target value. For example, for the students in the Sashelp.Class data set, you might want to find the students whose (Age, Height, Weight) values are closest to the triplet (13, 62, 100). The way to
About once a month I see a question on the SAS Support Communities that involves what I like to call "computations with combinations." A typical question asks how to find k values (from a set of p values) that maximize or minimize some function, such as "I have 5 variables,
Data analysts often fit a probability distribution to data. When you have access to the data, a common technique is to use maximum likelihood estimation (MLE) to compute the parameters of a distribution that are "most likely" to have produced the observed data. However, how can you fit a distribution
This article describes and implements a fast algorithm that estimates a median for very large samples. The traditional median estimate sorts a sample of size N and returns the middle value (when N is odd). The algorithm in this article uses Monte Carlo techniques to estimate the median much faster.
Your statistical software probably provides a function that computes quantiles of common probability distributions such as the normal, exponential, and beta distributions. Because there are infinitely many probability distributions, you might encounter a distribution for which a built-in quantile function is not implemented. No problem! This article shows how to