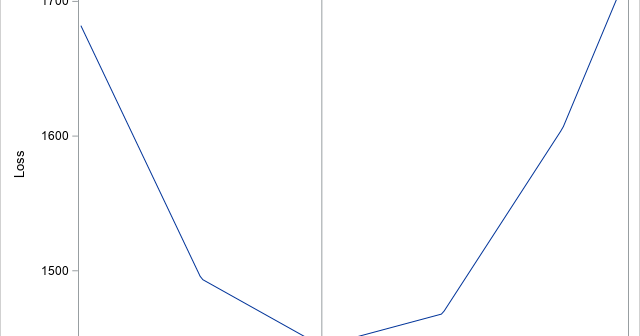
On Twitter, I saw a tweet from @DataSciFact that read, "The sum of (x_i - x)^2 over a set of data points x_i is minimized when x is the sample mean." I (@RickWicklin) immediately tweeted out a reply: "And the sum of |x_i - x| is minimized by the sample
Tag: Getting Started
I refer to the SAS documentation every day. Usually, I want information about SAS syntax and the statistical formulas and algorithms for various options and statements. Although I have bookmarked common documentation books and chapters, sometimes it is easier to perform an internet search to find information. I've discovered a
When there are two equivalent ways to do something, I advocate choosing the one that is simpler and more efficient. Sometimes, I encounter a SAS program that simulates random numbers in a way that is neither simple nor efficient. This article demonstrates two improvements that you can make to your
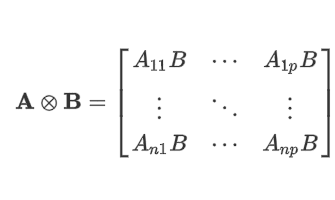
The Kronecker product (also called the direct product) is a binary operation that combines two matrices to form a new matrix. The Kronecker product appears in textbooks about the design of experiments and multivariate statistics. The Kronecker product seems intimidating at first, but often one of the matrices in the
I previously wrote about the advantages of adding horizontal and vertical reference lines to a graph. You can also add a diagonal reference line to a graph. The SGPLOT procedure in SAS supports two primary ways to add a diagonal reference line: The LINEPARM statement enables you to specify a
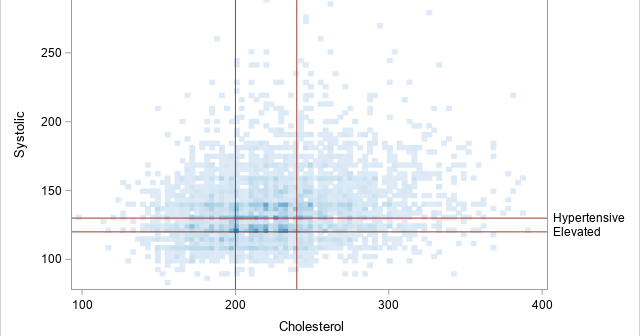
Data tell a story. A purpose of data visualization is to convey that story to the reader in a clear and impactful way. Sometimes you can let the data "speak for themselves" in an unadorned graphic, but sometimes it is helpful to add reference lines to a graph to emphasize
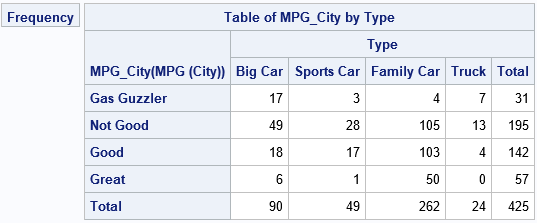
Recoding variables can be tedious, but it is often a necessary part of data analysis. Almost every SAS programmer has written a DATA step that uses IF-THEN/ELSE logic or the SELECT-WHEN statements to recode variables. Although creating a new variable is effective, it is also inefficient because you have to
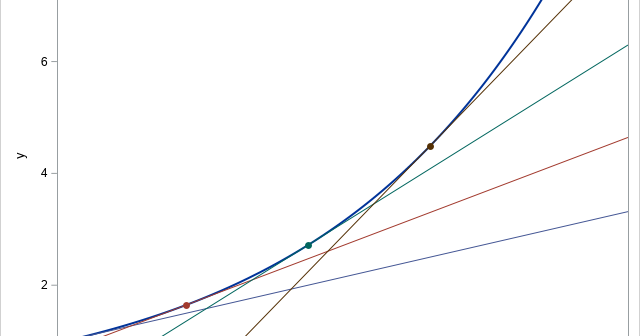
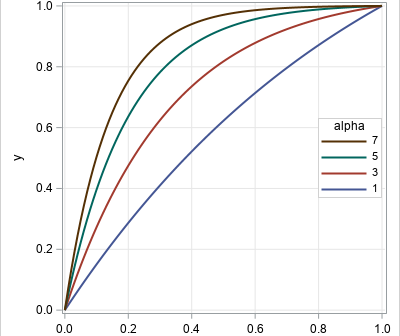
A family of curves is generated by an equation that has one or more parameters. To visualize the family, you might want to display a graph that overlays four of five curves that have different parameter values, as shown to the right. The graph shows members of a family of
A SAS programmer posted an interesting question on a SAS discussion forum. The programmer wanted to iterate over hundreds of SAS data sets, read in all the character variables, and then do some analysis. However, not every data set contains character variables, and SAS complains when you ask it to
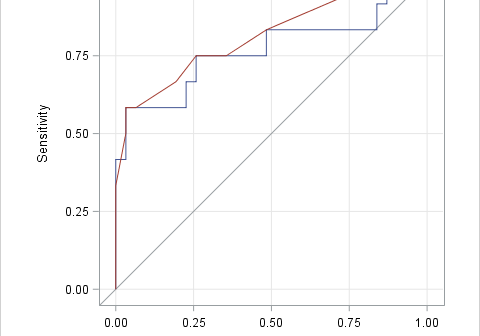
An ROC curve graphically summarizes the tradeoff between true positives and true negatives for a rule or model that predicts a binary response variable. An ROC curve is a parametric curve that is constructed by varying the cutpoint value at which estimated probabilities are considered to predict the binary event.