 Have you ever used SAS to produce reports for publishing? Have you ever thought of or been told about suppressing data in such reports? Why do we need to suppress (in the sense of withholding, concealing, obscuring or hiding) data in published reports?
The reason is simple - in order to protect privacy of individuals - personally identifiable information (PII) - data that could potentially identify specific individuals and their sensitive or confidential information. Such sensitive data can include health insurance and medical records, age, ethnicity, race, gender, education, political or religious believes, financial and credit information, geographical location, criminal history, student education records, etc.
In the U.S., such information is considered confidential and protected by Federal Law, e.g. HIPAA - Health Insurance Portability and Accountability Act and FERPA - Family Educational Rights and Privacy Act. Many other countries have similar laws and regulations.
When SAS is used to process surveys, generate and publish reports, we need to be on a lookout in order not to break the law since demographic component of any survey or report has a potential of breaching privacy protection, especially when we deal with a small group of people. For small reporting samples, even when we publish aggregated reports, there is still a risk of possible deducing or disaggregating personal data.
Grouping for data suppression
One way of obscuring small count numbers to protect people privacy is to lump them up into a larger group, call it “Others” and leave it there. However, while protecting PII this method distorts composition of the report group as it can put different demographic characteristics into “Other” category for different report groups thus making it impossible to compare them side by side.
Using custom formats for data suppression
Another way to suppress or mask small numbers is to use SAS custom formats. Let’s say we want to suppress all numbers in the range of 1 through 6, but show all other numbers as comma-formatted. We can create the following SAS user-defined custom numeric format to suppress small numbers:
proc format; value suppress 1-6='*' other=[comma12.] ; run; |
This works just fine for a single variable (list) frequency or cross-tabulation frequency numbers as long as there are no Total column or Total row presented. If Totals by row or column are reported then the suppressed small number cell can be easily derived from those totals and the values of the other unsuppressed numbers.
Primary and complementary data suppression
When a row or column contains just a single suppressed small number and in addition to frequencies (or counts) we also report totals by rows and/or columns, primary data suppression that is based on the number value itself is not enough for privacy protection as it can be calculated as total minus sum of the other reported numbers in that row or column.
To exclude the possibility of deducing suppressed data, this primary data suppression needs to be complemented by the secondary data suppression when a second small number in that row or column also needs to be suppressed. What further complicates matter is that as long as we suppress that second number in a row, that suppressed cell may become the only suppressed cell across the column. In such a case, it can be derived from the column total and other numbers in that column. To make sure we really protect privacy and eliminate the possibility of unraveling suppressed data in a manner we solve a Sudoku puzzle, we need to complement that secondary suppression with tertiary data suppression of that cell in that column. We will refer to those secondary, tertiary, and so on data suppressions as complementary data suppressions.
Depending on the cardinality of classification variables and data combination, the number of those complementary suppression iterations may vary.
Suppression rules
Unfortunately, there is no unambiguous scientific/statistical definition of “small count numbers” that are subject to suppression to protect personally identifiable information. Such definition of “small count numbers” that need to be suppressed in aggregated reports, suppression rules and suppression protocols vary by jurisdiction (country, state), industry, agency, study, data source, demographic characteristic, effective date, etc. Such definitions can be based on an interval between 1 and a certain threshold (in most cases between 4 and 15). For example, the Environmental Public Health Tracking Network currently suppresses cells based on non-zero counts less than six.
Interestingly, that zero usually is not considered as a “small number” to be suppressed, as zero reveals nobody’s info. Although there might be an interpretation of zeros as not suitable for primary suppression, but to be a fair game for complementary suppression, I don’t think it would make a lot of sense as it would make suppression inconsistent and dependent on the data composition. Besides, suppressing zeros and counting them as complementary may actually aid deducing values of other cells in a row or column that it is supposed to protect. Therefore, we will treat zeros as not to be suppressed neither in primary nor in complementary suppression. The reason is that zeros represent very useful and unique information without compromising any confidentiality, while “small numbers” are not so unique compared to zeros.
Numbers for totals by rows or columns are also subject to suppression by the same measure as the numbers for cross-tabulation cells.
To make our SAS implementation of the small cell numbers suppression as general as possible, we will use a range from 1 through a threshold denoted as &sup_max, where sup_max is a macro variable that can be assigned a value of any natural number.
Automatic suppression algorithm
To fully automate the process of data suppression I developed a simple yet efficient iterative algorithm for implementing small numbers cell suppression using SAS for a two-dimensional tabular report.
- Use proc means to calculate count totals and output results in a data table. Class variable values for the totals will have blank values.
- Sort the data table from step 1 by class-variable-1, count. That will order counts from smallest to largest within each value of the class-variable-1 (including blanks for totals).
- Read through the sorted data table from step 2 by class-variable-1 group and
- Replace all count values within [1, &sup_max] interval with a special missing value, .S. This is the primary suppression. All primary suppression “suspects” are “eliminated” during this first iteration.
- Also replace all count variables that are next larger to a suppressed value in a group. This is the secondary complementary suppression.
- If there are no numbers found to be eligible for primary suppression, the whole suppression process stops after this step without suppressing any data.
- Repeat steps 2 and 3 with class-variable-2 variable instead of class-variable-1. This is further complementary suppression.
- Keep repeating steps 2 and 3 while flipping class-variable-1 and class-variable-2 until step 3 produces no suppressed value.
- Use proc report to output the results with .S values formatted to *.
Suppression implementation with SAS
You can view, download and run the full sample of SAS suppression code.
The following are the code highlights.
- Sample data. Since I am creating sample data table within the SAS code itself, I started with a pre-aggregated data table just to cut down on the code size – the code shall work as fine using a non-aggregated input table with one observation per person.
- In the Assign macro variables section we assign values for the classification variable names, suppression threshold value ( %let sup_max = 6; ) and global macro variable sup_flag ( %let sup_flag = 1; ). It makes this suppression code implementation ready to be used within a SAS macro or a SAS Stored Process (STP).
- Proc format defines formats (notsorted) for class variables with blank value ' ' reserved for ‘Total’. It also defines format cntf for counts and a format $totbgf for background color of the Total column:
proc format;
   value $racef (notsorted)
      'M' = 'Martian'
      'A' = 'Asian'
      'B' = 'Black'
      'H' = 'Hispanic'
      'W' = 'White'
      ' ' = 'Total'
      ;
   value $agegf (notsorted)
      '1' = '<18'
      '2' = '19-64'
      '3' = '65-99'
      '4' = '100+'
      ' ' = 'Total'
      ;
   value cntf
      .S = '*'
      . = '0'
      other = [comma18.0]
      ;
   value $totbgf
      'Total' = "&hbcolor"
      ;
run;
- Proc means with completetypes and preloadfmt options to get all possible combinations of the class variable values:
proc means data=people_roster noprint completetypes;
   format &tclass1 &f1.. &tclass2 &f2..;
   class &tclass1 &tclass2 / preloadfmt order=data;
   var count;
   output out=people_sup sum(count)=count;
run;
- Calculate number of columns in the tabular report (needed for cosmetic purpose to apply distinct color to the background of the Total column):
/* get number of columns for table report */
data _null_;
   set people_sup (where=(_type_ eq 1)) end=e;
   totcol + 1;
   if e then call symput('totcol',strip(put(totcol + 2,best.)));
run;
- Suppression macro %suppress parses &dsname table created with proc means above by one of the class variables &supclass and replaces small numbers between 1 and &sup_max with special missing value .S (primary suppression). It also suppresses values next to the primary suppressed value if that value is the only suppressed value in the by group (secondary suppression). In addition, this macro assigns global macro variable &sup_flag to 1 if at least one suppression was done, and to 0 otherwise:
%macro suppress(dsname=,supclass=);

   proc sort data=&dsname;
      by &supclass count;
   run;

   %let sup_flag = 0;
   data &dsname (drop=_supnum_);
      set &dsname;
      by &supclass count;
      if first.&supclass then _supnum_ = 0;
      if (1 le count le &sup_max) or (_supnum_ eq 1 and count ne .S) then
      do;
         count = .S;
         call symput('sup_flag','1');
      end;
      if (count eq .S) then _supnum_ + 1;
   run;

%mend suppress;
- Macro %iterate_suppression to iterate macro %suppress call while it finds new cells to suppress (produces &sup_flag=1). For each iteration, &class1 and &class2 are swapped. This macro is invoked immediately after its definition.
%macro iterate_supression (class1=, class2=);

   %let nextclass = &class1;
   %do %while (&sup_flag);

      %suppress(dsname=people_sup, supclass=&nextclass);
      %if &nextclass eq &class1
         %then %let nextclass = &class2;
         %else %let nextclass = &class1;

   %end;

%mend iterate_supression;
%iterate_supression (class1=&tclass1, class2=&tclass2);
- Conditionally generate footnote if at least one cell is suppressed:
%let ftnote=;
data _null_;
   set people_sup (where=(count eq .S));
   call symput('ftnote',"j=L h=10pt '*) The data is suppressed to protect privacy'");
   stop;
run;
footnote &ftnote;
- Proc report to generate table output. Option preloadfmt preserves the classification variable values order as they are defined by proc format:
proc report data=people_sup nowd split='*' spanrows missing
            style(header)=[font_size=11pt just=C color=#&hfcolor]
            style(column)=[font_size=10pt just=L];
   column &tclass1 count,&tclass2 count=tot;
   define &tclass1 / group  order=data "&tlabel1" f=&f1.. preloadfmt style(column)=header[vjust=m cellwidth=1.5in color=#&hfcolor];
   define &tclass2 / across order=data "&tlabel2" f=&f2.. preloadfmt style(header)=[background=$totbgf.];;
   define count    / display 'People Reported' style(column)=[just=R cellwidth=1in] f=cntf.;
   define tot      / sum noprint;

   compute &tclass1;
      if &tclass1 eq ' ' then
      do;
         call define(_col_,'style',"style=[just=C font_size=11pt color=#&hfcolor]");
         call define(_row_,'style',"style=[font_weight=bold background=#&hbcolor]");
      end;
   endcomp;

   compute &tclass2;
      call define("_c&totcol._",'style',"style=[font_weight=bold just=R background=#&hbcolor]");
   endcomp;
run;
Suppression results
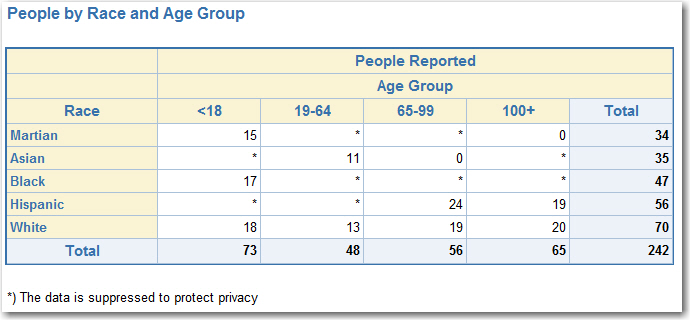
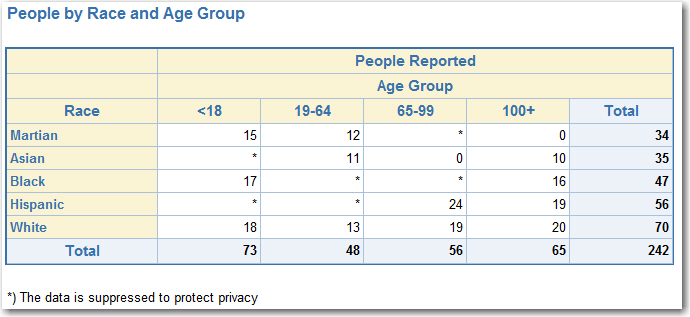
Notice, that all the data suppression manipulations are performed on a single summary data table produced by proc means at the very beginning. Since all the suppression processing is done on a small summary table, it makes its runtime insignificant. In the end, the report has all the small number cells suppressed by both, their values (primary suppression) and the values that complement small numbers in each row and each column (complementary suppression). There is no single suppressed cell in any row or column. This eliminates risk of uniquely deducing suppressed numbers. The following proc report output illustrates the resulting SAS report which is safe to publish:
Behind the curtain
In order to illustrate what is going on during execution of this suppression algorithm, I slightly modified the program to preserve all the interim data (work.people_sup1, work.people_sup2, . . . ) and print interim reports so you can see exactly what is going on at each iteration. You can view, download and run SAS suppression code version that produces interim results. Below are the reports produced at each iteration.
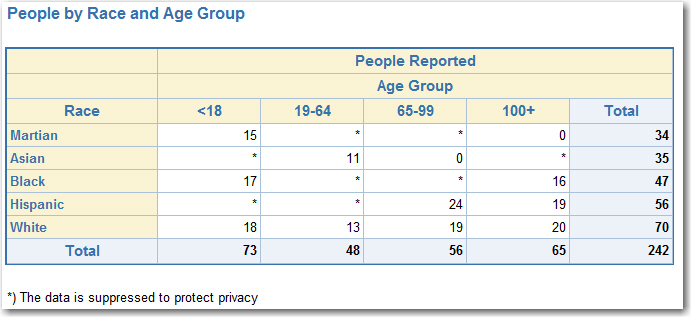
- Suppression iteration 1 (searching horizontally; if start searching vertically we still will arrive to the same end result)
- Start (here we do primary suppression of numbers between 1 and 6, as well as complementary suppression of second closest number; this iteration takes care of ALL primary suppressions since we search through every cell in a table):
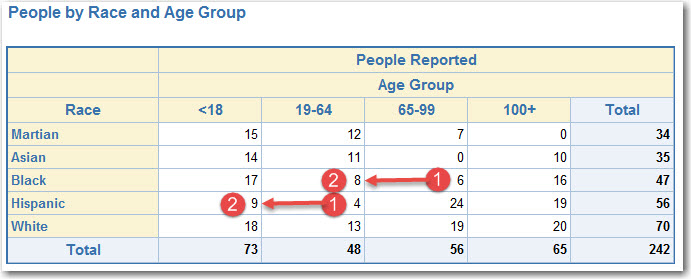
- Finish:
- Start (here we do primary suppression of numbers between 1 and 6, as well as complementary suppression of second closest number; this iteration takes care of ALL primary suppressions since we search through every cell in a table):
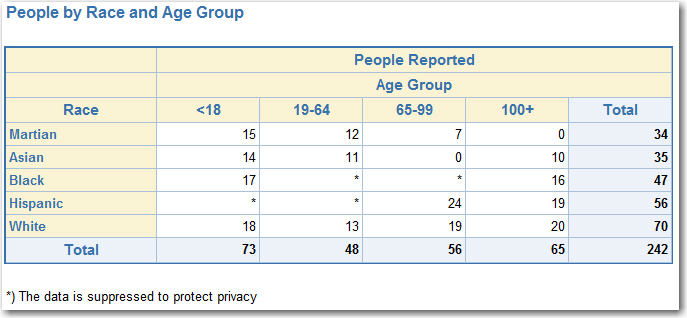
- Suppression iteration 2 (searching vertically)
- Start:
- Finish:
- Start:
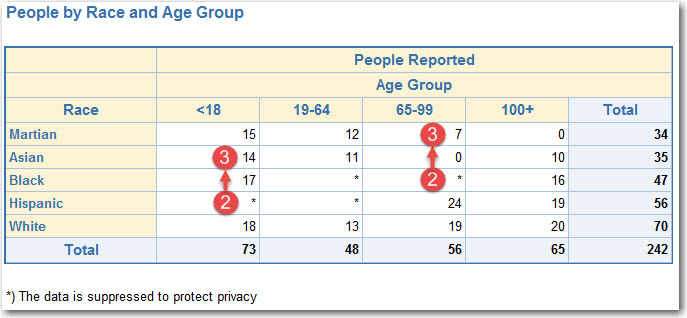
- Suppression iteration 3 (searching horizontally)
- Start:

- Finish:
- Start:
- Suppression iteration 4 (searching vertically)
- Start:
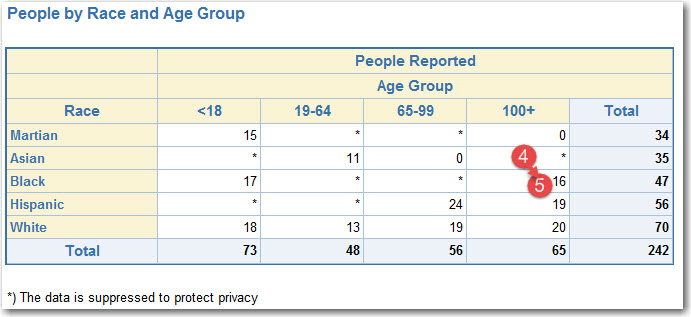
- Finish (now we have at least two suppressed cell in each column):
- Start:
- Iteration 5 (searching horizontally) did not produced any suppressed cells since we have at least two suppressed cell in each row; flag &sup_flag is set to 0 by macro suppress and the whole suppression process automatically stops.
Feedback
Your comments and suggestions are welcome as always.
P.S.
April 6, 2018 Update. SAS code samples for this post have been updated to incorporate newly developed enhanced complementary suppression algorithm. For more information on this topic please refer to the SAS Global Forum 2018 paper Implementing Privacy Protection-Compliant SAS® Aggregate Reports.

32 Comments
Hi Leonid,
Is it possible to run your suppression code on a table of three dimensions or more? That is, a table with three (or more) class-variables as far as I understand your code. If so, would it be possible for you to give an example of the code with three dimensions?
I especially have a hard time figuring out how to incorporate the third dimension into the "flip"/"swap" part of the %iterate_suppression macro.
Thanks,
Philip
Hi Philip,
Thank you for the great question. I believe it is possible, however, there might be more to it than just flipping dimensions. Here is how I would approach the "flip/swap" dimensions (untested, but gives you an idea in case you need 3 or more dimensions):
%macro iterate_supression (class1=, class2=, class3=);

   %let nextclass = &class1;
   %do %while (&sup_flag);

      %suppress(dsname=people_sup, supclass=&nextclass);

      %if &nextclass eq &class1 %then %let nextclass = &class2;
      %if &nextclass eq &class2 %then %let nextclass = &class3;
      %if &nextclass eq &class3 %then %let nextclass = &class1;

   %end;

%mend iterate_supression;
Please let me know if this works for you.
Regards,
Leonid
Dear Leonid,
thank you very much for the post and the code. I tried to adapt it to three dimentional dataset - simply by adding a third character variable - sex (M-male,F- female). The parts of code which in my opinion needed to be modified are the following:
- three new macro variables:
- additional variable format definition:
- proc report in column statement and in define statement;
- proc means in format and class statement;
- data _null_ datastep defining number of columns of the proc report result;
- %macro supppress:
a) one more parameter is needed: %macro suppress(in,supclass1,supclass2,out);
b) in proc sort in by statement: by &supclass1 &supclass2 count;
c) in by grouping processing of data &out datastep in by statement: by &supclass1 &supclass2 count;
- % macro iterate_suppresion by adding class3= parameter and defining two nextclass1 and nextclass2 macrovariables.
In fact one can get different results based on the order of variables defining dimensions of the data. I am wondering if it is possible to somehowe optimize the results to point out "the best" solution. One approach could be based on the minimizing the sum of counts suppressed by different order of variables used in the procedure. But the other could be based on the minimizing the number of cells suppressed. Do you have any suggestions in the matter? Thank you very much. Best regards, Tomasz
Hi Tomasz,
Great thoughts on the 3-D suppression implementation. I have to admit: 3-D suppression is really challenging. If you implemented your suggestions, would you please share your code (or link to your code)?
As for the optimization, you are correct - the results will depend on the data composition, the order of suppressed variables and, of course, selected optimization criteria.
Another, and perhaps the simplest, approach could be splitting 3-D report into several 2-D reports, that is using subsets of the data for each value of the third dimension. In this case, one can apply 2-D approach described in this post.
Hi Leonid,
thank you a lot for your response.
Below I attached the modified code based on your example. I hope it does not take too much space and I hope it is OK. Waiting for your reaction.
I also wonder how could I save results of 6 different approaches (below) and apply my optimisation criteria I mentioned in my previous post. How to compare six different datasets as far as sum of counts is concerned and number of non-suppressed cells?
Thank you, Tomasz!
Hi Leonid,
the code looks somehow strange (for instance proc format). Perhaps there is problem with character encoding in sas program I attached via web.
Regards,
Tomasz
Hi Tomasz, I formatted the code placing it within the following tags:
<pre escaped="true">
. . . /* your code is here */
</pre>
Please let me know if there are still problems.
Hi Leonid, now the code looks OK. Many thanks!
I hope it could be helpful.
Regards,
Tomasz
Hi Leonid,
I am wondering if there is a way to suppress the individual data points for one group of subjects on a scatter plot, while retaining the regression lines?
Thanks,
Tracy
Great question, Tracy. Could you please clarify what SAS PROC you are referring to? Or you are talking about SAS Visual Analytics?
This is the code I'm using.
All I had to do was add in the NOMARKERS option!
Hi Tracy, thank you for sharing your solution.
Actually, I worked it out! 🙂
Great! In case you would need a solution for SAS Visual Analytics, there is the Hidden data role for a Scatter Plot object that "specifies a category or date data item that is included in the data query without it being displayed. You can use the hidden data item when you map data sources, add color-mapped display rules, or add external links. For more information, see Understanding the Hidden Data Role in SAS Visual Analytics: Working with Report Data."
This is a keeper 👏
Protecting Privacy with suppression.
Thanks again for another great.
Data suppression, not just any suppression 🙂
Thanks Leonid for sharing the algorithm and code. Looking at the total number of lost cells and the number of lost people (9 cells in the given example), one can argue the outcome may not be better than just suppressing the four cells of 4, 6, 8 and 24 in the middle section. I wonder if an objective function can be applied and multile outcomes are compared in order to provide the optimized result.
Thank you George for your feedback!
I agree with you that for a particular table composition there might be a number of ways to suppress the cells, and there might be different optimization criteria. The question arises what is the best optimization criteria: to minimize the number of suppressed cells, or suppress the sum of suppressed counts (people), or to minimize the maximum count, or else. Different table compositions may produce totally different results depending on the set criteria. To me this issue is pretty much open...
Thanks Leonid, your quick response is much appreciated.
I was wondering if the optimisation criteria can be treated as a macro parameter so that the user can choose/compare/decide; and I understand this is easy to say but lots of work ...
Hi George,
Yes, from the implementation point of view you may have a macro with additional parameter (e.g. METHOD=) that would specify suppression method to be used. Then you would have to supply/code those various suppression methods implementations. One of them is using PROC OPTMODEL as described in the Optimal Cell Suppression in SAS blog post. There is also a high level review of various suppression algorithms (network optimization, linear programming, integer programming, etc.) presented in the Optimization Models and Programs for Cell Suppression in Statistical Tables paper.
You can run your macro with all the available methods thus generating multiple valid solutions. But still, how do you pick your best solution? What is the best solution? And whatever you pick as the best solution may vary for different table compositions. I see a potential consistency issue if in a single publication one would use several suppressed tables, each produced by a different suppression algorithm.
Hi Leonid,
We don’t have SAS/OR license so PROC OPTMODEL is not an option for me. As to the best solution, my personal view, in order, is to 1) minimize the number of suppressed cells, 2) minimize the sum of suppressed counts (people), and 3) minimize the maximum count (listed in your previous message). Quite often small cell suppressing is done manually in publications and the algorithm is unknown or mixed. Optimized outcome may come from different algorithms for varying tables; I am not sure the consistency is a big issue. The important here is I have learnt your algorithm and your smart code as my starting point. Thank you very much!
Hi George,
Your prioritization makes a lot of sense. Please note, that the newer, augmented version of my algorithm is presented in the SAS Global Forum 2018 paper Implementing Privacy Protection-Compliant SAS® Aggregate Reports were “enhanced complementary suppression” is introduced.
Thank you again for your valuable feedback.
Thank you, Leonid, for posting this solution. I ran several times into such requirements generally from EDU customers. And it is great to have direct access to a proven implementation now.
Diana, please read the comment above by Kristian Lønø and my reply to it.
This is a interesting solution for a problem we have to deal with at my work, Statistics Norway. I have written a similar program and then I found one special situation where the suppressed numbers are easy to unveil. It is when all the suppressed cells in a row or a column have the values of 1. Then the number of suppressed cells will be the same as the sum of suppressed values which means all the suppressed values in that row or column have to be 1. If we use this infile istead of the one in your example we can easily unveil the suppressed values.
data people_roster;
length ageg $1;
input ageg $ race $ count;
datalines;
2 M 1
2 M 1
1 A 1
1 M 1
1 B 1
2 A 1
1 H 7
2 W 8
;
run;
It would be interesting to add a solution to this problem to your program. The program I wrote was longer than yours and became even longer when I took care of this special situation.
Kristian, it was nice meeting you at SAS Global Forum in Orlando earlier this month. Thank you for taking the lead to set up our meeting to discuss complementary suppression issue that you describe in your comment. That is definitely a flaw in the complementary suppression algorithm implemented and presented in this blog post. I will have to revisit it and address that. I think I will be able to modify the complementary suppression algorithm in a way that can be implemented by adjusting logic in the %suppress macro. I will definitely let you know when I have a chance to implement this improvement. Thank you for your finding and your continued interest in this fascinating topic.
Hi Kristian,
I have modified the suppression code referenced in this blog post to address your special case. I called it "enhanced complementary suppression". For more details, please refer to my paper at SAS Global Forum 2018, Implementing Privacy Protection-Compliant SAS® Aggregate Reports.
Again, thank you for your valuable feedback that allowed me to improve the suppression algorithm and its SAS coding implementation.
~ Leonid
Thanks Leonid. I work with payroll system data that has public, private and confidential components based on State Data Practices and federal laws. I believe that I'll be able to use this more automated process to assist with sensitive reporting areas.
Arlen, great! I am glad to hear it's been useful. Let us know how it is going to work out for you.
These are some nice ideas. Thanks for gathering them into a single place. I am continually surprised by the many applications of PROC FORMAT.
Thank you, Rick, for your feedback. It is very much appreciated.