 New in the 7.3 release, SAS Visual Analytics now provides sample objects. During installation, the SAS Deployment Wizard prompts you to include sample reports by default. In addition to eight reports, an exploration and ten sample datasets are also included in the samples. These sample reports and datasets are available by industry or business issue (e.g. Warranty) and help you see the potential of the software immediately after the configuration.
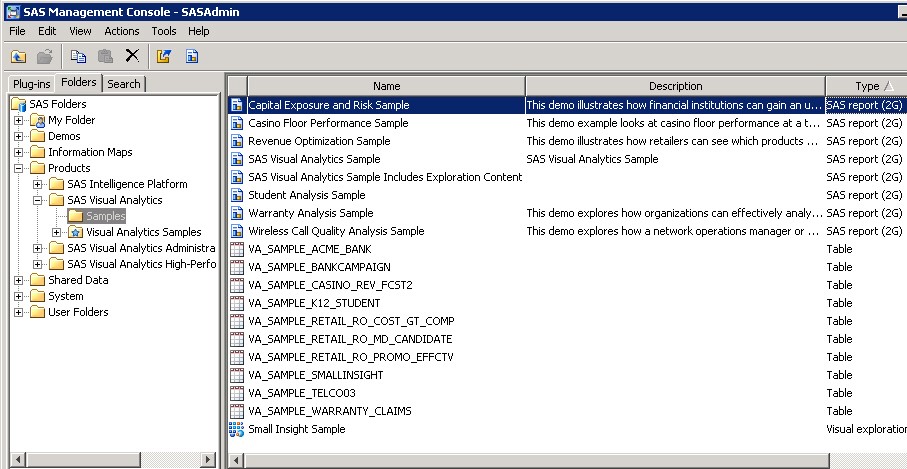
During the configuration, the installer will see a prompt to Install Visual Analytics Sample Reports. The checkbox to install the samples is checked, by default, but if you choose not to install the samples during the configuration, you can configured it later. When the samples are loaded, the objects shown below are in SAS Folders/Products/SAS Visual Analytics/Samples. The automatic configuration also creates a sample collection containing the eight reports, called Visual Analytics Samples.
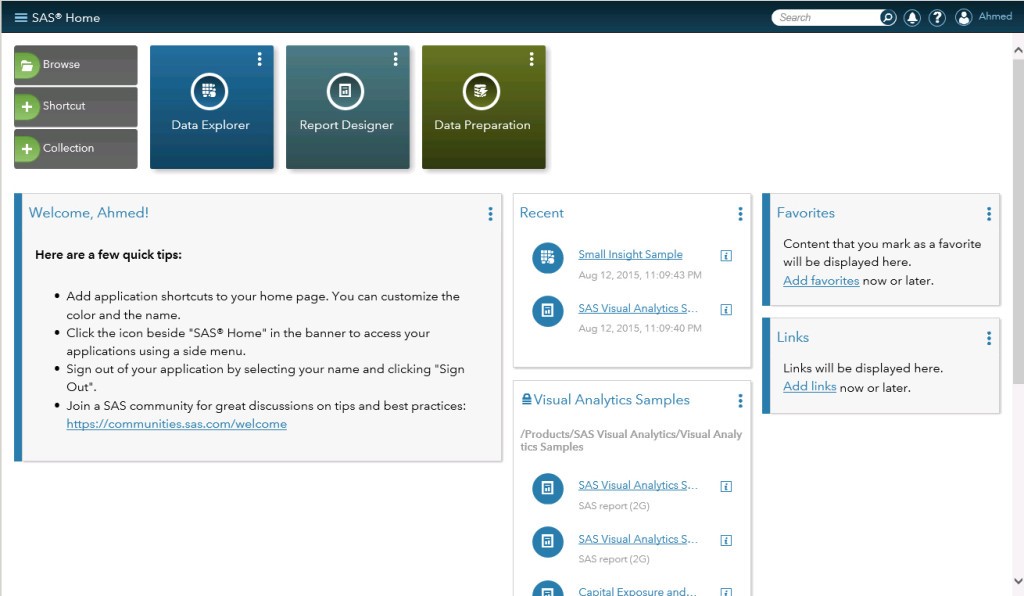
Initially, all registered users can see the sample objects, so when signed on to the home page, a user will see the Visual Analytics Samples collection. Provided the sample tables are loaded, any of the sample reports can be viewed.
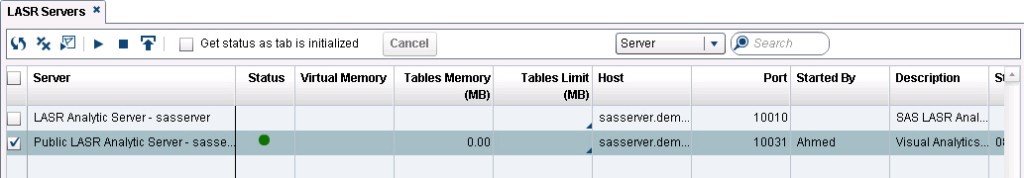
When the administrator starts the Public LASR Server, the sample tables are automatically loaded:
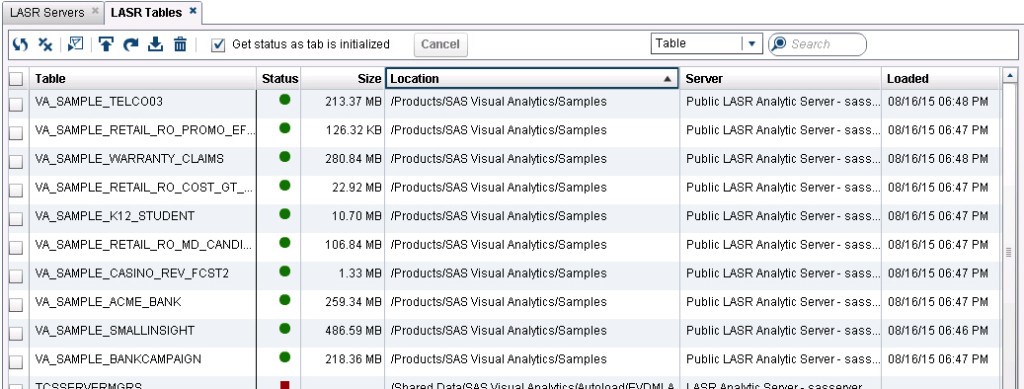
It will take a minute or two for all of the ten tables to display a loaded status:
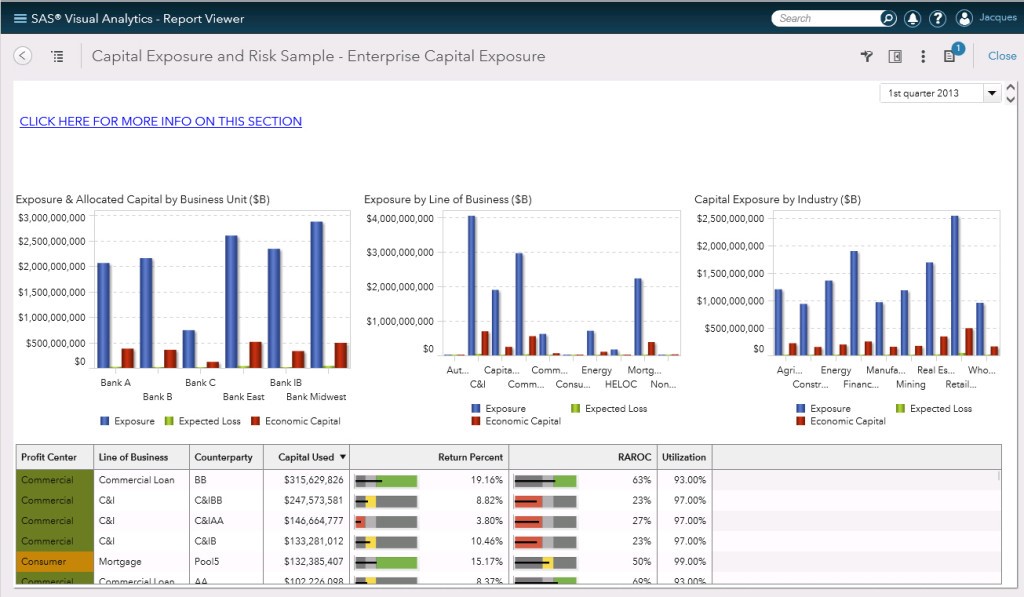
Once the tables are loaded, any registered users can view and interact with any of the reports from the collection in the home page. The reports employ a wide variety of report objects and features, so be sure and check out all eight reports. The report below is the Capital Exposure and Risk sample report.
For instructions on configuring the sample objects after the Visual Analytics configuration, see the Sample Objects topic in Appendix 1 of the SAS Visual Analytics 7.3 Administration Guide.

3 Comments
what is the best objects to use if i want to display a single data?
for example i want to display total sales.i know i can use list as the object however it gonna look ugly.
total sales = XXXXX.
Ahmad, try using a button bar to display your total. See my comment in this SAS Communities blog to see how to use a button bar to display text and values. https://communities.sas.com/t5/SAS-Visual-Analytics/Can-we-display-parameter-value-on-report-or-under-report-header/m-p/255518/highlight/false#M3566
It looks much nicer than the list table.
Very useful to have the reports installed and the tables loaded upon starting the LASR server. Great work!