What's the most common data reporting mechanism? Is it web-based reporting? PDFs? How about spreadsheets? Maybe, but in my experience many reports are delivered using a less-scalable and transient mechanism: e-mail.
I'm a data steward at SAS. Specifically, I look after the operational data around our blogging program and our online communities. Even though we have many self-serve reports already set up for these programs, I'm often approached with specific one-off questions. When I get asked the same question multiple times, I'll create a report that runs automatically and stays current for future requests. But for most jobs I find myself running queries and pasting the result into e-mail. Just because the request is ad-hoc doesn't mean it has to take a lot of time or appear as "quick and dirty." Here's my process for creating solid e-mail responses that please my stakeholders.
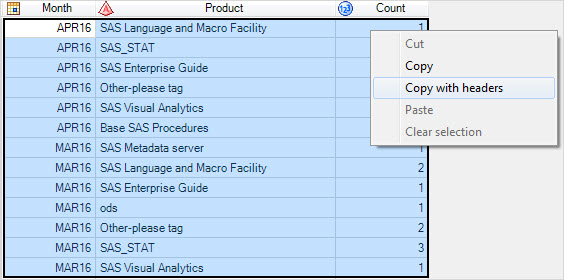
Step 1: Select data values, then Copy with Headers
This is one of my favorite new features in SAS Enterprise Guide 7.1. I use this technique several times per week. It's a big time saver because it grabs the selected data values and their column names. It places them onto the Windows clipboard as tab-delimited data.
If you don't have version 7.1 then you can approximate this technique by selecting Send To->Microsoft Excel. This launches Microsoft Excel, opens a new sheet and populates it with all of the data in the data grid, including the headers. You can then copy your selection from the sheet and continue.
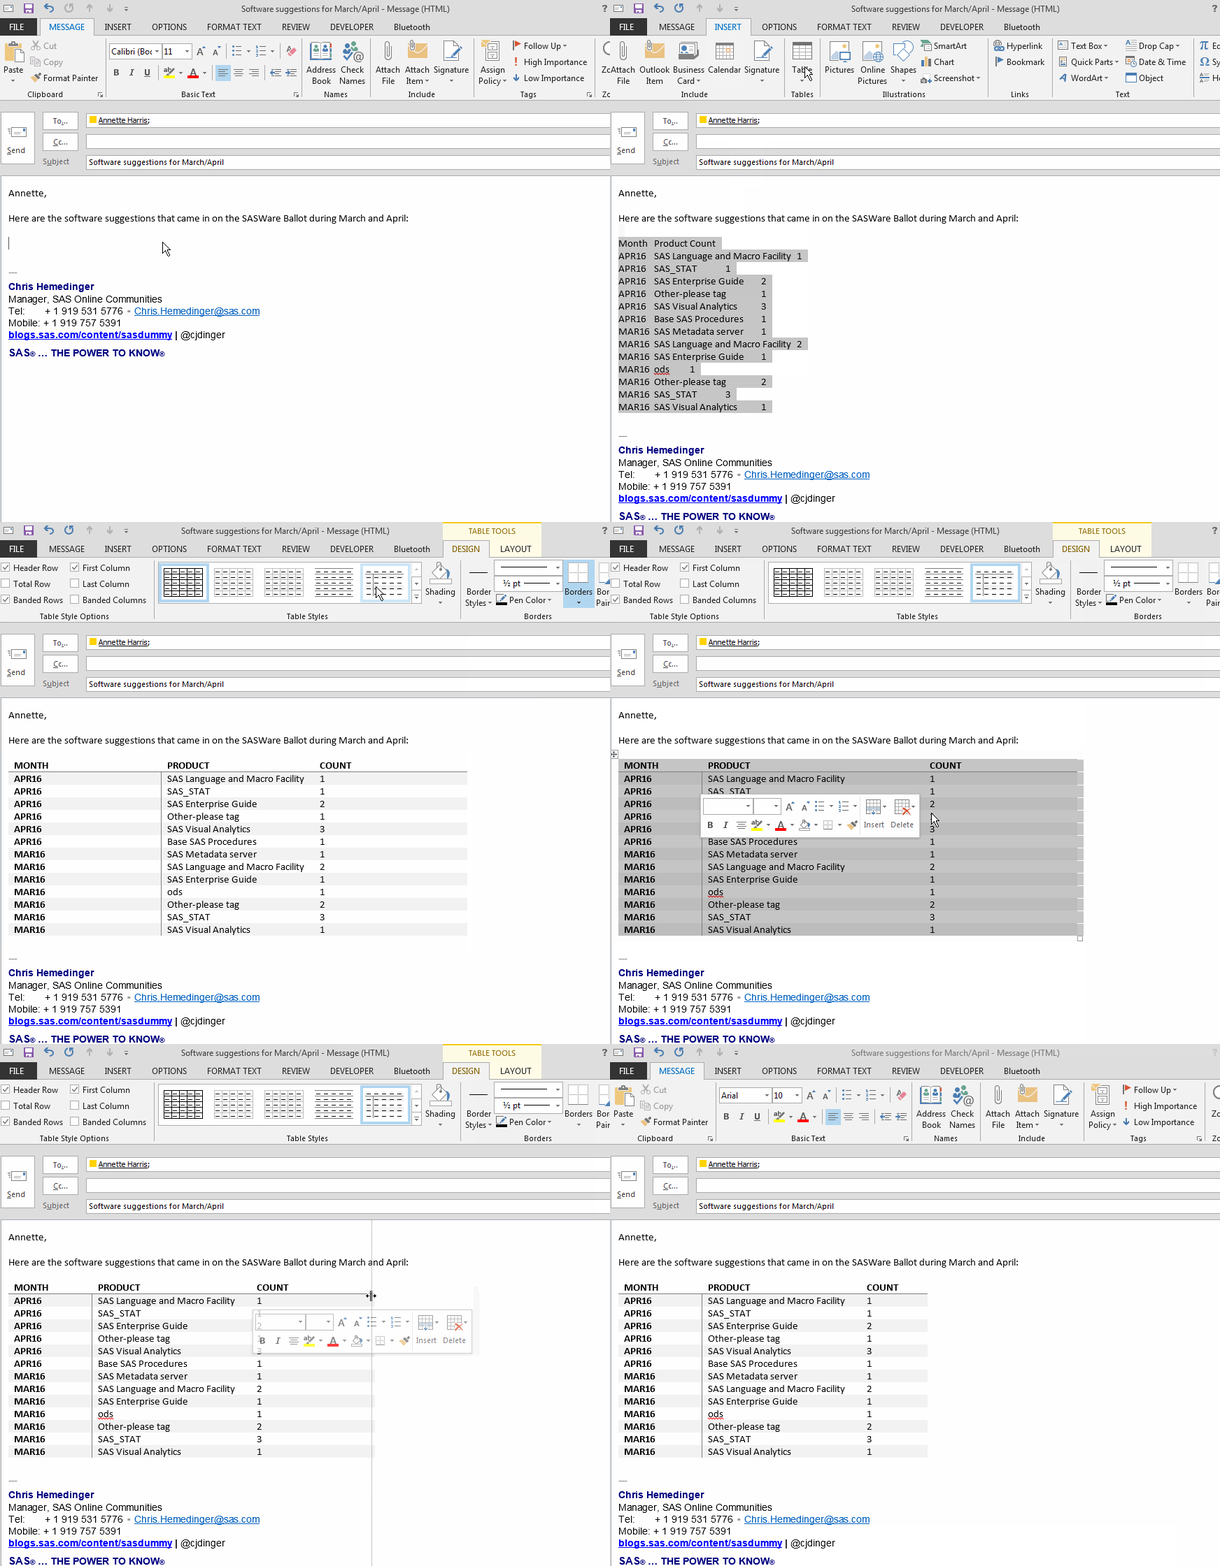
Step 2. Paste selection into new e-mail message
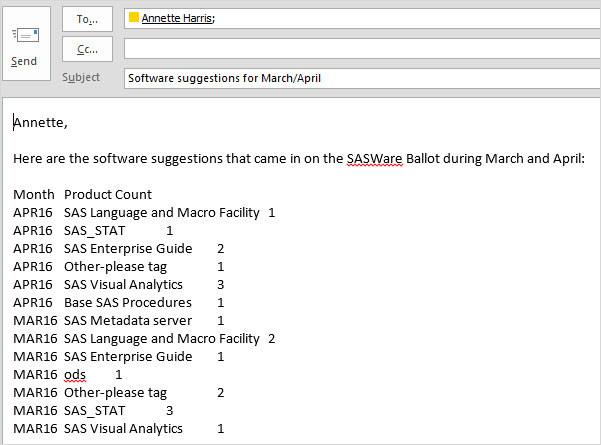
When you paste tab-delimited data into Microsoft Outlook, you get a raggedy-looking set of lines. But don't worry -- Step 3 will take care of that. Other e-mail programs might actually create a table for you automatically.
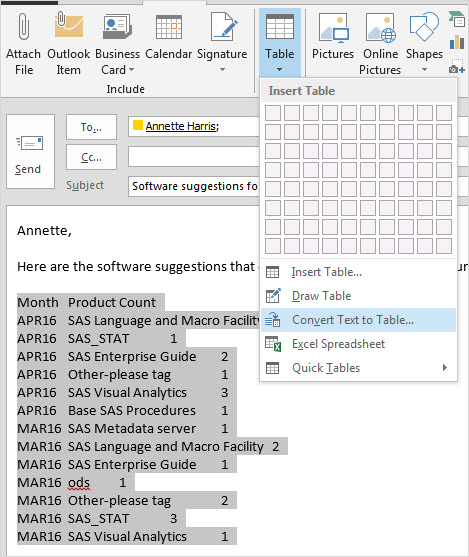
Step 3. Apply "Convert text to table" action
In Microsoft Outlook, this is an option on the Message menu, under the Table pulldown. It converts your selected text into a true table, offering you options to confirm the number of columns and rows. Or use this shortcut: simply select Insert Table with your data selected, and Outlook creates the table.
Optional Step 4: Beautify
Microsoft Outlook offers a number of canned crowd-pleasing table layouts that will format your headings, rows and columns so they look fancy yet readable. Pick your favorite and apply.
You can see me stumble through all of the steps in this animation:
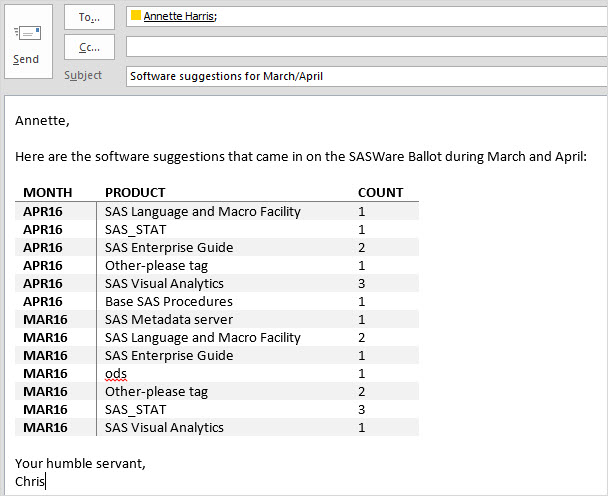
The result is an attractive table that answers a question. It looks like something that might have taken you hours to prepare. There is one danger though: because you accomplished the task so quickly, your constituents might feel emboldened to ask more difficult questions, and with greater frequency.


2 Comments
Nice to see your SAS AU user group meeting presentation, TIP #4 COPY DATA AND COLUMN HEADERS come to life :-)
http://www.sas.com/content/dam/SAS/en_au/doc/User%20Groups/smug/2016-presentations/smug-master-presentations.pdf
It's an interesting point you make though with many self-serve reports available, the data steward is often still asked to provide answers via email. Good that SAS EG has this copy & paste nifty trick!
I didn't know you could use what I consider a handy Excel feature in Outlook.
I usually paste the SAS Report result to Outlook and then fiddle with it.
Good tip!