Strengthen your programming skills with tips and techniques from the experts
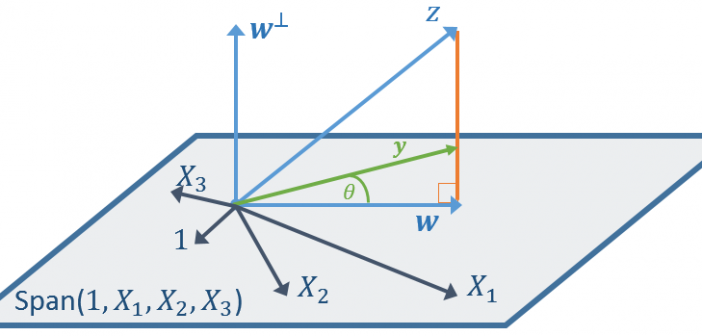
When you perform a linear regression, you can examine the R-square value, which is a goodness-of-fit statistic that indicates how well the response variable can be represented as a linear combination of the explanatory variables. But did you know that you can also go the other direction? Given a set

